P(true) Task
In the P(true) task, participants read a statement, for example a general-knowledge claim, and indicate how likely they think it is to be true by clicking on a probability scale from 0% to 100%. Each statement has a known truth value. After each response, the task can reveal whether the statement was true and award imaginary coins according to a scoring rule, so that participants are rewarded for responses that are both accurate and well calibrated.
The task collects continuous probability judgements rather than binary true/false answers. This makes it suitable for research on confidence, calibration, metacognition, misinformation and the "wisdom of crowds". It was developed for a study in which 376 online participants rated the probability of 1,200 general-knowledge claims, to test how individual probability ratings can be combined into accurate collective judgements1.
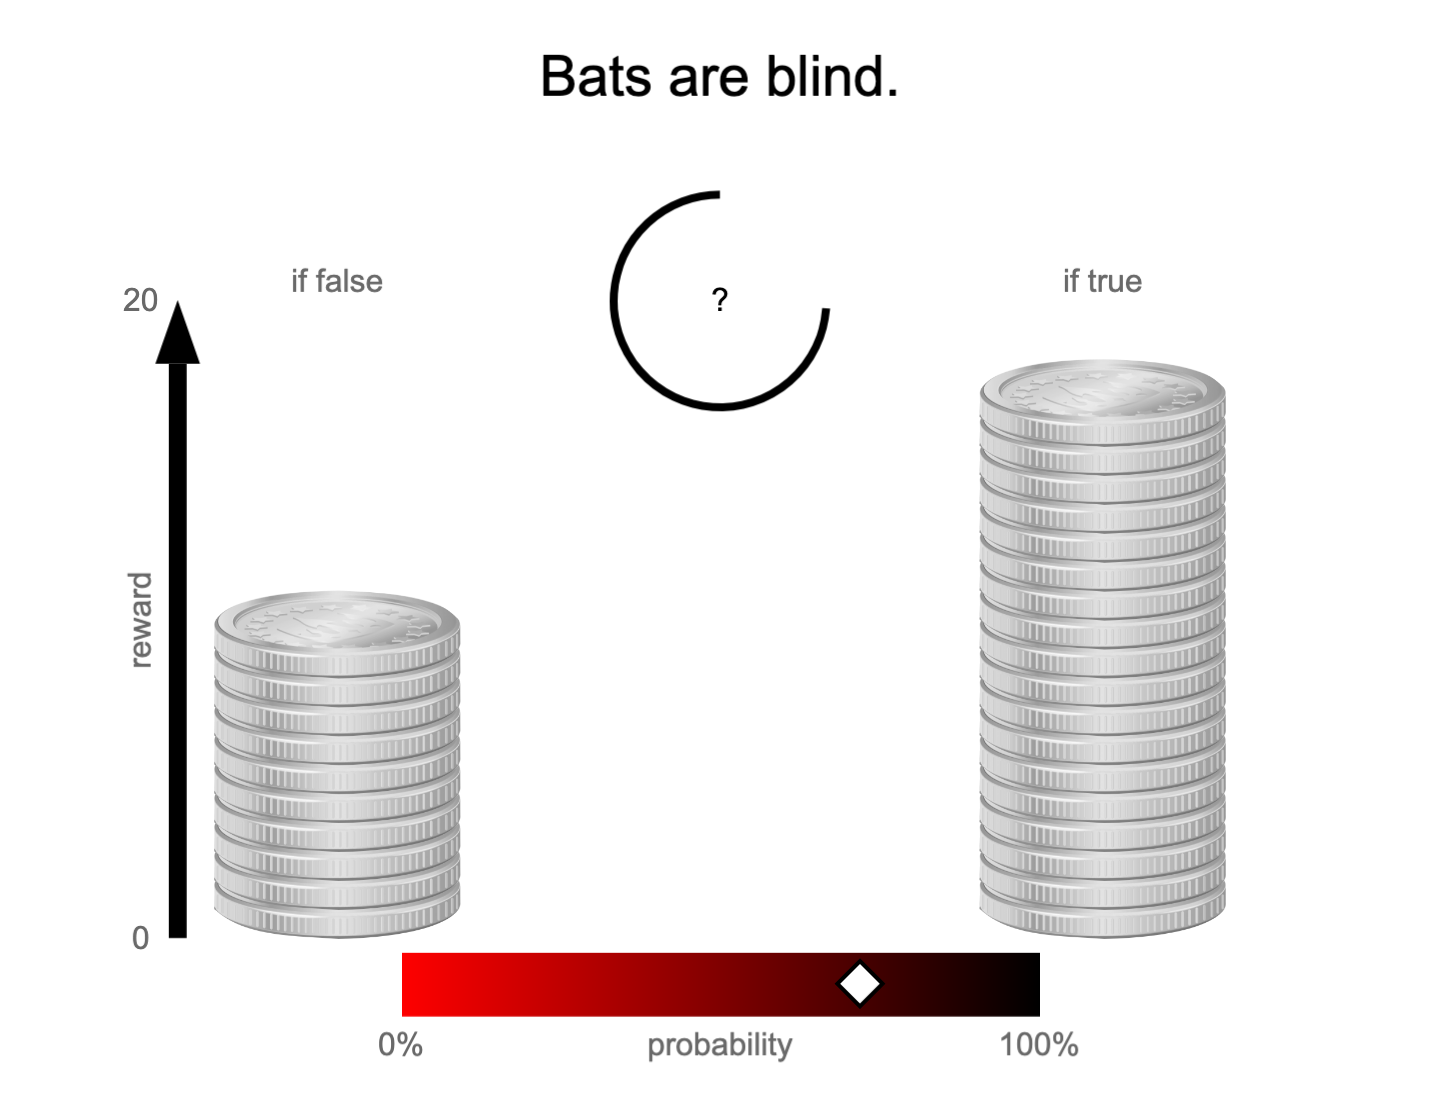
Example P(true) trial with Show Reward Stacks and Show Reward Axis enabled. With the cursor at 72% and a quadratic reward function, the participant would earn 18 coins if the statement is true, and 10 coins if it is false.
Below you'll find information specific to the P(true) task. This assumes you're familiar with how to setup an experiment and how to select stimuli for a given task.
Quick Start
- Create a stimulus set with your statements as text stimuli, marking each as
trueorfalse(see Preparing statements) - Create or open an experiment from your Dashboard
- Click Add task and select "P(true)", then select your stimulus set
- Choose which feedback and rewards to show on the Parameters tab, then preview your experiment
New to Meadows? See the Getting Started guide for a complete walkthrough.
Preparing statements
The P(true) task uses text stimuli. Each text stimulus has three fields, which correspond to the three columns of an uploaded table:
- Short: the statement as shown to the participant, e.g.
The Great Wall of China is visible from the Moon with the naked eye. - Long: the truth value of the statement: exactly
trueorfalse(upper or lower case both work). - Comment (optional): a short explanation shown after the response, if
Show Claim Feedbackis enabled, e.g.It is too narrow to be seen from that distance.
Statements containing commas are easiest to upload as a tab-separated (.tsv) file. See Uploading a table with text stimuli for details.
Trial procedure
Each trial shows one statement at the top of the screen. Below it is a circular timer, and below the timer a horizontal probability bar running from 0% (left) to 100% (right).
- Choice. By default, a diamond-shaped cursor follows the mouse along the probability bar, and the participant clicks on it to submit their rating. With
Drag And Dropenabled, the participant drags the cursor to a position instead, and confirms by clicking the timer, which then reads confirm. Meanwhile the ring of the timer runs down over theTimeoutduration. If time runs out, the current cursor position is recorded as the response (50% if the participant did not move it). - Feedback. Depending on the parameters, the task now shows whether the statement was true, the comment, and the coins earned. The timer reads continue; the participant clicks it to move to the next statement. There is no time limit on this phase.
- End. After the last statement, the task can show an overview table with every statement, its truth value, the participant's rating, and the coins earned. The participant then continues to the next task with the toolbar button.
The number of trials is the number of statements in the selected stimuli, or Maximum Number Of Trials, whichever is smaller. To present a large set across several sessions or blocks, add multiple P(true) tasks, each with a subset of the statements.
Rewards
When rewards are enabled, the participant earns coins on every trial. The size of the reward depends on the rating p (between 0 and 1) and the truth value of the statement t (1 if true, 0 if false):
The exponent k is set by Reward Function: 1 for linear, 2 for quadratic, 3 for cubic. A rating of 100% on a true statement earns the full Maximum Reward, and a rating of 0% on a true statement earns nothing.
With the linear function, the reward decreases in proportion to the distance between the rating and the truth value. With the quadratic and cubic functions, the reward decreases with the square or the cube of that distance, so it decreases slowly for small distances and more steeply for large ones. The quadratic function corresponds to the Brier score.
The coin stacks shown during the choice phase (Show Reward Stacks) show the participant what they would earn if the statement turned out to be false (left) or true (right), at the current cursor position. The stacks change in size as the cursor moves.
Parameters
Customize the task by changing these on the Parameters tab of the task.
General Interface settings
Instruction hint-
Text that you can display during the task at the top of the page.
Extended instruction-
A longer instruction that only appears if the participant hovers their mouse cursor over the hint.
Fullscreen button-
Whether to display a button in the bottom toolbar that participants can use to switch fullscreen mode on and off.
Trials and responses
Item Size-
Size of the statement text, in % of the width of the screen. Default: 8. Valid range: 0.2 to 20.
Maximum Number Of Trials-
The number of trials equals the number of statements, or this parameter, whichever is smaller. Default: 50. Valid range: 1 to 10,000.
Timeout-
Time allowed for each response, in seconds. When the time runs out, the current cursor position is recorded. Default: 10. Valid range: 0 to 600.
Wait Button Label-
The label on the toolbar button while the task is still in progress. Default: "Not done yet..". Max 20 characters.
Drag And Drop-
If enabled, the participant drags the cursor along the probability bar and confirms with a click on the timer. Otherwise (the default), the cursor follows the mouse and a click on the cursor submits the rating straight away. Default: unchecked.
Feedback
Show Trial Feedback-
After each response, display "true" or "false". Default: unchecked.
Show Claim Feedback-
After each response, display the comment of the statement (the third column of the text stimulus). Default: unchecked.
Show Overview Feedback-
At the end of the task, display a table of all statements with their truth value and the participant's rating. Default: unchecked.
Show Overview Reward-
At the end of the task, display the participant's rating for every statement. Combined with
Show Overview Feedback, the table also shows the coins earned for each statement. Default: unchecked.
Reward
Reward Function-
How the reward depends on the distance between the rating and the truth:
Linear,QuadraticorCubic. See Rewards. Default:Linear. Maximum Reward-
Number of coins for a fully correct response (100% for a true statement, or 0% for a false one). Default: 20. Valid range: 1 to 1000.
Show Reward Stacks-
During the choice phase, display two coin stacks on either side of the probability bar, labelled if false and if true. Their heights show the reward for the current cursor position. After the response, the stack that matches the truth value is shown. Default: unchecked.
Show Reward Stack Chosen-
After the response, display a single coin stack above the chosen position on the probability bar, with the coins earned. Default: unchecked.
Show Reward Functions-
Display two curves above the probability bar that show the reward for each possible rating: black if the statement is true, red if it is false. After the response, only the curve that matches the truth value remains. Default: unchecked.
Show Reward Axis-
Display a vertical axis labelled reward, from 0 to the maximum reward, next to the coin stacks. Default: unchecked.
Highlight Reward-
Effects applied briefly to the earned coin stack after the response. Select any combination:
Opacity: stacks are shown semi-transparent, and the earned stack becomes fully opaqueBlend Color: the earned stack is tinted goldTeleport: the earned stack disappears from beside the bar after the highlight, and then appears among the progress stacks (see below)
Default: none.
Highlight Reward Duration-
How long the highlight effects last, in milliseconds. Default: 500. Valid range: 0 to 60,000.
Progress
Show Reward Progress-
During the task, display the total number of coins earned so far in the bottom right corner. Default: unchecked.
Show Perfect Reward Progress-
Next to the total coins earned, display the maximum total that could have been earned so far, e.g. "143 / 200". Requires
Show Reward Progress. Default: unchecked. Show Reward Stacks Progress-
During the task, collect a small copy of each earned coin stack in a row at the bottom of the screen. Default: unchecked.
Number Of Progress Stacks-
The maximum number of progress stacks displayed. When the row is full, the oldest stack is removed. Default: 50. Valid range: 1 to 300.
Location Of Latest Progress Stack-
Where the newest progress stack is placed horizontally, from 0 (left edge) to 1 (right edge). Older stacks move to the left. Default: 0.5.
Data
For general information about the various structures and file formats that you can download for your data see Downloads.
Stimulus-wise "annotations" (table rows). Each row is one rated statement. Columns:
task: name of the taskparticipation: name of the experiment/participationtrial: numerical index of the trialtime_trial_start: timestamp when the statement was displayed (seconds since 1/1/1970)time_trial_response: timestamp when the rating was submitted, or when the time ran out (seconds since 1/1/1970)stim1_id: Meadows internal ID of the statementstim1_name: the statement text (the first column of the text stimulus)label: the rating, as a probability between 0 and 1
The truth value is not included in the annotations. Match it from your own table of statements using stim1_name (see the examples below).
A trial that timed out has a response time equal to the Timeout, and its label is the cursor position at that moment, or 0.5 if the participant didn't move it. There is no separate column for timeouts, so use the response time to identify them.
In the Tree structure, under the task object:
annotations: an array with a key/value map for each trial:trial: numerical index of the trialstart: timestamp (epoch time) of the start of the trial, in seconds since 1/1/1970resp: timestamp (epoch time) of the response, in seconds since 1/1/1970ids: array containing the ID of the statementlabel: the rating, as a probability between 0 and 1
stimuli: array of stimulus objects withidandnamefields
Analysis
The examples below combine the annotations with the table of statements you uploaded (statements.tsv, with columns statement, truth value, comment, and no header row). They then compute per-participant accuracy and Brier score, and plot a calibration curve.
Accuracy, Brier score and response time
import pandas as pd

df = pd.read_csv('Meadows_myExperiment_v1_annotations.csv')
statements = pd.read_csv('statements.tsv', sep='\t', header=None,
                         names=['statement', 'veracity', 'comment'])
statements['truth'] = statements['veracity'].str.strip().str.lower().eq('true').astype(int)
df = df.merge(statements[['statement', 'truth']],
              left_on='stim1_name', right_on='statement')

df['rt'] = df['time_trial_response'] - df['time_trial_start']
timeout = 10  # the Timeout parameter, in seconds
df['timed_out'] = df['rt'] >= timeout - 0.1

# Accuracy: rating on the correct side of 50%; Brier score: lower is better
df['correct'] = (df['label'] > 0.5) == (df['truth'] == 1)
df['brier'] = (df['label'] - df['truth']) ** 2

summary = (df[~df['timed_out']]
    .groupby('participation')
    .agg(accuracy=('correct', 'mean'),
         brier=('brier', 'mean'),
         median_rt=('rt', 'median'),
         n=('label', 'size')))
print(summary)
library(tidyverse)

df <- read_csv('Meadows_myExperiment_v1_annotations.csv')
statements <- read_tsv('statements.tsv', col_names = c('statement', 'veracity', 'comment')) %>%
  mutate(truth = as.integer(tolower(trimws(veracity)) == 'true'))
df <- df %>% inner_join(statements %>% select(statement, truth),
                        by = c('stim1_name' = 'statement'))

timeout <- 10  # the Timeout parameter, in seconds
df <- df %>%
  mutate(rt = time_trial_response - time_trial_start,
         timed_out = rt >= timeout - 0.1,
         correct = (label > 0.5) == (truth == 1),
         brier = (label - truth)^2)

df %>%
  filter(!timed_out) %>%
  group_by(participation) %>%
  summarise(accuracy = mean(correct), brier = mean(brier),
            median_rt = median(rt), n = n())
Calibration curve
A well-calibrated participant is right about 70% of the time when they give a rating of 70%. Plot the proportion of true statements against the binned ratings; points below the diagonal at high ratings (and above it at low ratings) indicate overconfidence.
import numpy as np
import matplotlib.pyplot as plt

# continues from the example above
bins = np.linspace(0, 1, 11)
df['bin'] = pd.cut(df['label'], bins, include_lowest=True)
calib = df.groupby('bin', observed=True).agg(
    mean_rating=('label', 'mean'), prop_true=('truth', 'mean'))

plt.plot([0, 1], [0, 1], '--', color='gray')
plt.plot(calib['mean_rating'], calib['prop_true'], 'o-')
plt.xlabel('Rating P(true)')
plt.ylabel('Proportion of statements that are true')
plt.title('Calibration')
plt.show()
# continues from the example above
calib <- df %>%
  mutate(bin = cut(label, breaks = seq(0, 1, 0.1), include.lowest = TRUE)) %>%
  group_by(bin) %>%
  summarise(mean_rating = mean(label), prop_true = mean(truth))

ggplot(calib, aes(mean_rating, prop_true)) +
  geom_abline(linetype = 'dashed', color = 'gray') +
  geom_point() + geom_line() +
  coord_equal(xlim = c(0, 1), ylim = c(0, 1)) +
  labs(x = 'Rating P(true)', y = 'Proportion of statements that are true',
       title = 'Calibration') +
  theme_minimal()
References
-
Stinson, P., van den Bosch, J., Jerde, T., & Kriegeskorte, N. (2025). Collective inference of the truth of propositions from crowd probability judgments. arXiv preprint arXiv:2501.04983. doi:10.48550/arXiv.2501.04983 ↩