Stimulus Form Task
The Stimulus Form task presents stimuli one-by-one (or in small groups) and collects custom ratings or responses through configurable form elements. Each stimulus is accompanied by a form containing sliders, text inputs, or multiple-choice questions that you design based on your research needs.
This flexible task allows systematic collection of multi-dimensional assessments for each stimulus, making it suitable for norming studies, validation research, and exploratory data collection.
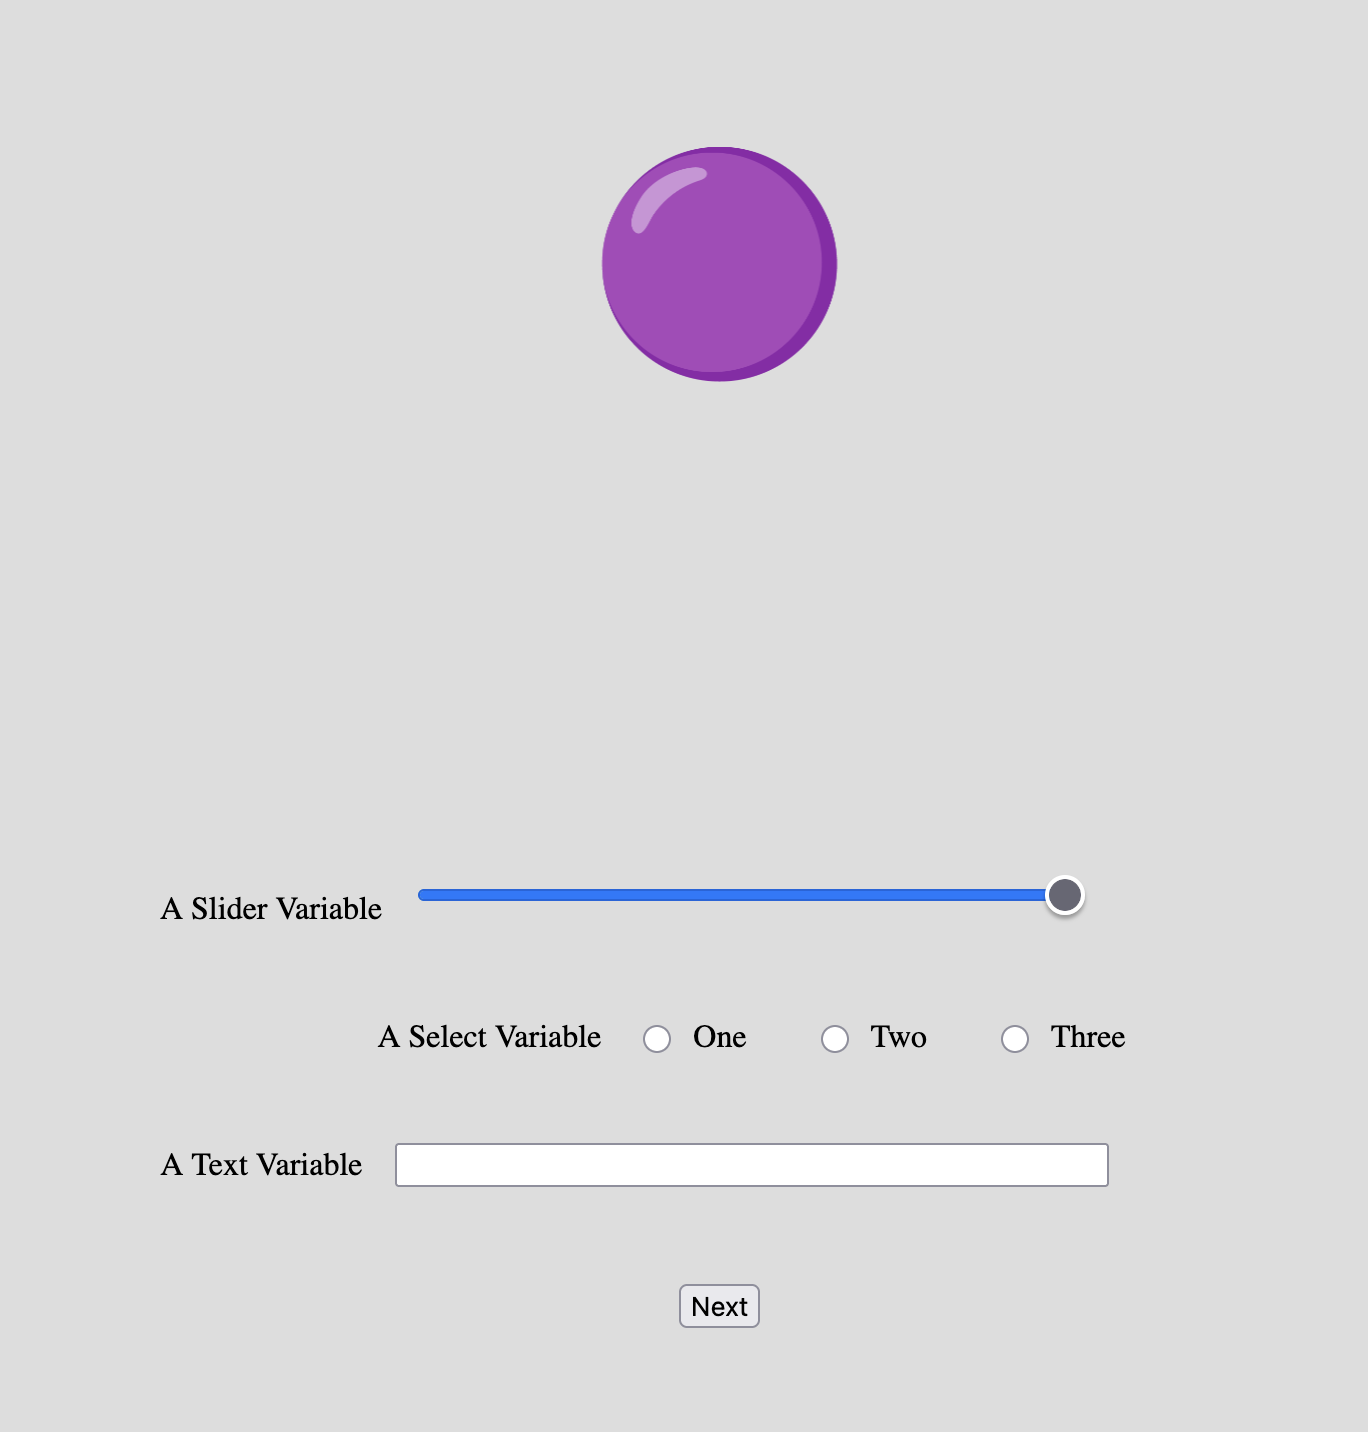
Example Stimulus Form showing a stimulus (purple sphere) with three types of form elements: a slider, radio buttons, and a text input field.
Quick Start
- Create or open an experiment from your Dashboard
- Click Add task and select "Stimulus Form"
- Select a stimulus set to rate
- Configure your form elements (sliders, text fields, or radio buttons) on the Parameters tab
- Preview your experiment to verify the layout
New to Meadows? See the Getting Started guide for a complete walkthrough.
Alternative tasks
- Use Drag & Rate for continuous two-dimensional ratings with spatial positioning
- Use Label for simple categorization or tagging of stimuli
- Use Gallery Select for selecting subsets of stimuli based on criteria
- Use Dynamic Form for a single form not tied to stimulus presentation
Parameters
Customize the task by changing these on the Parameters tab of the task.
General Interface settings
Customize the instruction at the top of the page, as well as toolbar buttons. These apply to most task types on Meadows.
Instruction hint-
Text that you can display during the task at the top of the page.
Extended instruction-
A longer instruction that only appears if the participant hovers their mouse cursor over the hint.
Hint size-
Whether to display the instruction, or hide it, and what font size to use.
Fullscreen button-
Whether to display a button in the bottom toolbar that participants can use to switch fullscreen mode on and off.
Background color-
The colour of the task screen behind the stimuli. Use either a colour name (e.g.
lightgray) or a hexadecimal RGB value (e.g.#c395e6). Default:#DDDDDD, a light grey.
Stimulus Display
Item Size-
Height of the stimuli (in the unit selected below). Default: 8.0. Must be between 0.2 and 40.0. The width is adapted according to the original aspect ratio of the stimulus.
Item Unit-
The unit to use for the size of the stimuli. Options:
- Percentage of the available width (default)
- Centimeters - requires participant calibration
- Visual angle in Degrees - requires participant calibration and distance measurement
Layout-
Where the form sits relative to the stimuli, and how much room the stimulus area takes up. Options:
Classic: fixed stimulus area, form below(default): a fixed area is of half the width and half the height of the screen is always reserved for the stimuli, whatever their size, and the form goes underneath it.Form below the stimuli: the stimulus area shrinks to fit your stimuli plus the padding, and the form sits directly underneath.Form to the right, stimuli centered on screen: as above, but the form moves to the right of the stimuli while the stimuli stay on the centre line of the screen.Form to the right, stimuli aligned left: as above, but the stimuli are aligned to the left edge instead.
Which option suits you depends mostly on the shape of your stimuli:
- Tall stimuli (e.g. faces) already use the height, so the space going spare is at the sides — one of the "form to the right" options usually works best.
- Wide stimuli (e.g. landscape scenes) already use the width, so
the space going spare is below —
Form below the stimulisuits them. - Square stimuli, especially two or three per trial, are the case where
Stimulus paddingmatters most: without it, neighbouring stimuli can end up touching at larger item sizes. Pair it with theCenteredarrangement below, which is the one that puts the padding between them.
Stimulus padding-
Extra space around the stimuli, and between adjacent stimuli when you show more than one per trial. Increase this if your stimuli sit too close together, or touch each other, at larger item sizes. Expressed in the same unit as
Item Size. Default: 2.0. Must be between 0.0 and 20.0. Under theDistributedarrangement below, the horizontal gaps are set by the even spacing instead, so there the padding only affects the space above and below the stimuli. Stimulus arrangement-
How the stimuli are arranged horizontally when you show more than one per trial. Options:
Distributed(default): spread evenly over the stimulus area — with two stimuli, at one third and two thirds of the way across. The gaps are whatever the even spacing makes them, soStimulus paddingdoes not affect them.Centered: kept together in the middle, neighbours separated by exactlyStimulus padding. Use this when stimuli end up too close together — or touching — at larger item sizes.Justified: the outer stimuli are pushed out to the edges of the stimulus area. Use this when you want them as far apart as possible.
With a single stimulus per trial all three are identical.
Stimulus duration-
How long the stimulus is shown before it disappears, in milliseconds. The form remains visible and usable after the stimulus disappears, so this lets you collect a response about a stimulus that is no longer on screen. Default: 1000000. Valid range: 100 to 86,400,000. Set to 1,000,000 ms (1000 seconds) or more to keep the stimulus visible for the whole trial.
Form Configuration
Configure the form elements that participants will use to provide responses about each stimulus.
Form Elements-
A list of form elements to display. Each element has the following properties:
Name: The field name in your data (1-12 alphanumeric characters, no special characters)
Title: The label shown to participants (1-40 characters)
Kind: The type of input widget. Options:
Slider: Continuous scale from 0 to 1Text: Free-text input fieldRadio Buttons: Multiple-choice selection
Options: For Radio Buttons only, list the choices participants can select from (maximum 20 options, each up to 50 characters)
Stimuli per trial-
How many stimuli to display simultaneously. Options:
1: Single stimulus (most common)2: Pair of stimuli (for comparative judgments)3: Triplet (for triadic comparisons)
Default: 1.
Maximum number of trials-
The task will present either all unique combinations of stimuli or this maximum number, whichever is smaller. Default: 2000. Valid range: 1 to 10,000.
Form font size-
Size of the form text, in pixels. Default: 16. Must be between 8 and 48.
The whole form scales with this one number: the label column, the slider, the radio buttons and the button all grow and shrink together. It does not change with the participant's screen size, so pick a size that suits the labels you have written and check it in Preview.
If the form ends up too big for the screen — a large font, many form elements, or long labels — it gets a scroll bar rather than spilling off the page. If your participants would have to scroll, use a smaller font, fewer or shorter fields, or one of the
Form to the rightlayouts. Next button label-
The text displayed on the button at the bottom of the form that advances to the next stimulus. Default: "Next".
Data
For general information about the various structures and file formats that you can download for your data see Downloads.
Trial-wise "annotations" (table rows), with one row per trial. Columns:
trial- numerical index of the trialtime_trial_start- timestamp when the stimulus and form were displayed (seconds since 1/1/1970)time_trial_response- timestamp when the participant submitted the form (seconds since 1/1/1970)stim1_id- meadows internal id of the first stimulusstim1_name- filename of the first stimulus as uploadedstim2_id- (ifstimuli_per_trial≥ 2) meadows internal id of the second stimulusstim2_name- (ifstimuli_per_trial≥ 2) filename of the second stimulusstim3_id- (ifstimuli_per_trial= 3) meadows internal id of the third stimulusstim3_name- (ifstimuli_per_trial= 3) filename of the third stimuluslabel- JSON string containing all form responses with field names as keys
The label column contains a JSON object with your custom form field names and their values. For example, if you configured fields named "pleasantness", "familiarity", and "category", the label might be:
In the Tree structure, form responses are stored in the annotations array with the same structure as described above.
Analysis
Parse and Analyze Form Responses
The form responses are stored as JSON in the label column. Here's how to parse and analyze them:
In Google Sheets or Microsoft Excel, you can analyze form responses from your downloaded annotations data.
- Load Data: Import the
Meadows_myExperiment_v1_annotations.csvfile. - Parse JSON: The
labelcolumn contains JSON. You can: - Use the "Split text to columns" feature with
"and,as delimiters (works for simple cases) - Or manually copy values for specific stimuli
- For more complex parsing, consider using Python or R
- Extract Field Values: If your JSON has
{"pleasantness": "0.75"}, after splitting you can extract the numeric values - Calculate Statistics:
- Mean:
=AVERAGE(column) - Standard deviation:
=STDEV.S(column) - Min/Max:
=MIN(column)and=MAX(column) - Create Pivot Table: Summarize ratings by stimulus using
stim1_nameas Row and average of your rating column as Value - Visualize: Create histograms or bar charts to show rating distributions or per-stimulus averages
import pandas as pd
import json
import matplotlib.pyplot as plt

# Load the annotations data
df = pd.read_csv('Meadows_myExperiment_v1_annotations.csv')

# Parse the JSON label column
df_responses = pd.json_normalize(df['label'].apply(json.loads))

# Combine with stimulus information
df_full = pd.concat([df[['trial', 'stim1_name', 'time_trial_start',
                          'time_trial_response']], df_responses], axis=1)

# Calculate response time in seconds
df_full['response_time'] = (df_full['time_trial_response'] -
                             df_full['time_trial_start'])

# Example: Analyze a slider variable (assuming you have a 'pleasantness' field)
if 'pleasantness' in df_full.columns:
    df_full['pleasantness'] = pd.to_numeric(df_full['pleasantness'])

    print(f"Mean pleasantness: {df_full['pleasantness'].mean():.3f}")
    print(f"SD pleasantness: {df_full['pleasantness'].std():.3f}")

    # Plot distribution
    plt.figure(figsize=(10, 6))
    plt.hist(df_full['pleasantness'], bins=20, edgecolor='black')
    plt.xlabel('Pleasantness Rating')
    plt.ylabel('Frequency')
    plt.title('Distribution of Pleasantness Ratings')
    plt.show()

    # Top 10 most pleasant stimuli
    top_stimuli = (df_full.groupby('stim1_name')['pleasantness']
                   .mean()
                   .sort_values(ascending=False)
                   .head(10))
    print("\nTop 10 most pleasant stimuli:")
    print(top_stimuli)
library(tidyverse)
library(jsonlite)

# Load the annotations data
df <- read_csv('Meadows_myExperiment_v1_annotations.csv')

# Parse the JSON label column
df_responses <- df %>%
  mutate(parsed = map(label, fromJSON)) %>%
  unnest_wider(parsed)

# Calculate response time
df_responses <- df_responses %>%
  mutate(response_time = time_trial_response - time_trial_start)

# Example: Analyze a slider variable (assuming 'pleasantness')
if ('pleasantness' %in% colnames(df_responses)) {
  df_responses <- df_responses %>%
    mutate(pleasantness = as.numeric(pleasantness))

  # Summary statistics
  df_responses %>%
    summarise(
      mean_pleasantness = mean(pleasantness, na.rm = TRUE),
      sd_pleasantness = sd(pleasantness, na.rm = TRUE),
      n_ratings = n()
    ) %>%
    print()

  # Plot distribution
  ggplot(df_responses, aes(x = pleasantness)) +
    geom_histogram(bins = 20, fill = 'steelblue', color = 'black') +
    labs(x = 'Pleasantness Rating', y = 'Frequency',
         title = 'Distribution of Pleasantness Ratings') +
    theme_minimal()

  # Top 10 most pleasant stimuli
  df_responses %>%
    group_by(stim1_name) %>%
    summarise(mean_pleasantness = mean(pleasantness, na.rm = TRUE)) %>%
    arrange(desc(mean_pleasantness)) %>%
    head(10)
}
Analyze Categorical Responses
For radio button selections:
import pandas as pd
import json

# Load and parse data
df = pd.read_csv('Meadows_myExperiment_v1_annotations.csv')
df_responses = pd.json_normalize(df['label'].apply(json.loads))
df_full = pd.concat([df[['stim1_name']], df_responses], axis=1)

# Example: Analyze a categorical variable (assuming 'category' field)
if 'category' in df_full.columns:
    # Count frequency of each category
    category_counts = df_full['category'].value_counts()
    print(category_counts)

    # Crosstab: category by stimulus
    crosstab = pd.crosstab(df_full['stim1_name'], df_full['category'])
    print(crosstab)
library(tidyverse)
library(jsonlite)

# Load and parse data
df <- read_csv('Meadows_myExperiment_v1_annotations.csv')
df_responses <- df %>%
  mutate(parsed = map(label, fromJSON)) %>%
  unnest_wider(parsed)

# Example: Analyze categorical variable
if ('category' %in% colnames(df_responses)) {
  # Frequency table
  df_responses %>%
    count(category) %>%
    arrange(desc(n))

  # Crosstab by stimulus
  df_responses %>%
    count(stim1_name, category) %>%
    pivot_wider(names_from = category, values_from = n, values_fill = 0)
}