Cambridge Face Perception Test
This pre-configured paradigm lets you collect data using the Cambridge Face Perception Test (CFPT) - a widely-used assessment of face perception abilities that measures the capacity to discriminate between similar-looking faces. With this "preset", you can quickly evaluate perceptual discrimination without memory demands. This page explains how to use the preset, what data you'll collect, and how to analyze your results.
Unlike the Cambridge Face Memory Test (CFMT) which tests memory for faces, the CFPT evaluates perceptual discrimination. Participants sort 6 test faces according to their similarity to a target face, with the test faces created by morphing the target with other faces at varying levels.
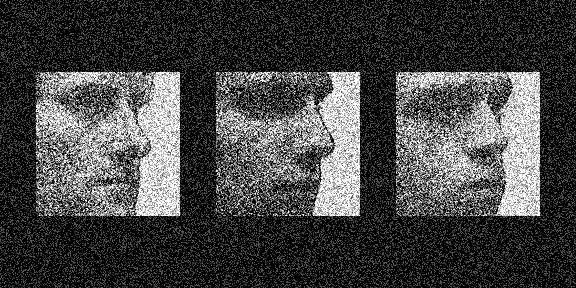
Example trial from the Cambridge Face Perception Test showing faces at different levels of similarity to a target face.
Quick Start
- Create or open an experiment from your Dashboard
- Click Add pre-configured tasks
- Choose "Cambridge Face Perception Test"
- Preview your experiment
New to Meadows? See the Getting Started guide for a complete walkthrough.
Background
The CFPT was developed by Duchaine and colleagues as a complementary measure to the CFMT, designed to distinguish between perceptual and memory-based face processing deficits12. The test is particularly valuable for assessing individuals with prosopagnosia, as it can reveal whether face recognition difficulties stem from perceptual problems (inability to distinguish faces) or memory problems (difficulty learning and remembering faces).
In each trial, participants see a target face at the top of the screen and six test faces below, presented in random order. The task is to arrange the test faces from most similar to least similar to the target face. The test includes both upright and inverted face trials, as face inversion typically impairs face processing more than it affects object processing.
Test Structure
The preset includes five tasks that together comprise the complete CFPT. Participants typically complete the test in 15-20 minutes.
- Overview Instruction - Explains the task
- Practice Instruction - Introduces practice trials
- Practice Trials - 2 practice trials (1 upright, 1 inverted)
- Main Instruction - Transition to the test phase
- Main Trials - 16 test trials (8 upright, 8 inverted)
Each trial allows up to 60 seconds for sorting. Participants can arrange faces by clicking and dragging, and proceed to the next trial when ready or when time expires.
Tasks Included
This preset contains the following tasks:
| Task Name | Task Type | Description |
|---|---|---|
cfpt_overview_instruction |
info |
Introduction to the test |
cfpt_practice_instruction |
info |
Practice phase instructions |
cfpt_practice |
ordersort |
2 practice trials |
cfpt_main_instruction |
info |
Main test instructions |
cfpt_main |
ordersort |
16 test trials (8 upright, 8 inverted) |
Data
For general information about the various structures and file formats that you can download for your data see Downloads.
As trial-wise "annotations" (table rows), with columns:
trial- numerical index of the trialtime_trial_start- timestamp when the trial began (seconds since 1/1/1970)time_trial_response- timestamp when the participant submitted their ordering (seconds since 1/1/1970)stim1_id,stim2_id, ... - Meadows internal ids of the stimulistim1_name,stim2_name, ... - filenames of the stimuli in the order presentedlabel- the response data in format{moves}_{order}, where moves is the number of drag operations and order is the final arrangement (e.g.,3_stim2-stim1-stim3-stim4-stim5-stim6)
Analysis
Scoring the CFPT
The CFPT is scored by calculating the sum of absolute deviations between the participant's ordering and the correct ordering. Lower scores indicate better performance.
In Google Sheets or Microsoft Excel, you can score the CFPT from your downloaded annotations data:
-
Load Data: Import the
Meadows_myExperiment_v1_cfpt_main1_annotations.csvfile. -
Extract Participant Order: Split the
labelcolumn (assuming it's in column K) to get the order part after the underscore. In column L: -
Extract Individual Positions: Split the hyphen-separated order into 6 columns (M through R). In column M:
In column N:=TRIM(MID(SUBSTITUTE($L2, "-", REPT(" ", 100)), 101, 100))
Continue for columns O, P, Q, R (changing 1→101, 101→201, 201→301, 301→401, 401→501)
-
Extract Morph Levels: For each stimulus (columns C-H), extract the morph percentage (last number before .jpg). In column S for stim1:
Copy this formula to columns T, U, V, W, X for stim2-stim6. -
Calculate Position Error: For each position in the participant's order, find where that stimulus should be (based on morph level) and calculate absolute error. This requires manual sorting or using RANK functions.
-
Simpler Approach: Use COUNTIF to count inversions. For a quick approximation, count how many pairs are out of order compared to the correct sequence based on morph levels.
-
Total Score: Sum all position errors across trials (lower is better).
Note: The exact calculation is complex in spreadsheets. For precise scoring, we recommend using Python or R.
import pandas as pd
import numpy as np

# Load the annotations data
df = pd.read_csv('Meadows_myExperiment_v1_cfpt_main1_annotations.csv')

def calculate_cfpt_score(row):
    """Calculate the sum of absolute position errors"""
    # Parse the label: format is "{moves}_{order}"
    # e.g., "3_stim2-stim1-stim3-stim4-stim5-stim6"
    parts = row['label'].split('_', 1)
    moves = int(parts[0])
    participant_order = parts[1].split('-') if len(parts) > 1 else []

    # Get stimulus names and their morph levels
    stim_names = [row[f'stim{i}_name'] for i in range(1, 7)]
    morph_levels = {}
    for stim_name in stim_names:
        # Extract morph level from filename (e.g., "ere_02_12.jpg" -> 12)
        morph = int(stim_name.split('_')[-1].split('.')[0])
        morph_levels[stim_name] = morph

    # Correct order: smallest to largest morph (most to least similar)
    correct_order = sorted(stim_names, key=lambda x: morph_levels[x])

    # Calculate sum of absolute position errors
    error = 0
    for i, stim in enumerate(participant_order):
        correct_pos = correct_order.index(stim)
        error += abs(i - correct_pos)

    return error

# Calculate scores for each trial
df['error_score'] = df.apply(calculate_cfpt_score, axis=1)

# Total score (lower is better)
total_error = df['error_score'].sum()
print(f"Total Error Score: {total_error}")
print(f"Mean Error per Trial: {df['error_score'].mean():.2f}")

# Identify upright vs inverted trials
df['is_inverted'] = df['stim1_name'].str.contains('inv_')
upright_error = df[~df['is_inverted']]['error_score'].mean()
inverted_error = df[df['is_inverted']]['error_score'].mean()

print(f"\nUpright Mean Error: {upright_error:.2f}")
print(f"Inverted Mean Error: {inverted_error:.2f}")
print(f"Inversion Effect: {inverted_error - upright_error:.2f}")
library(tidyverse)

# Load the annotations data
df <- read_csv('Meadows_myExperiment_v1_cfpt_main1_annotations.csv')

# Function to calculate error score for each trial
calculate_error <- function(row) {
  # Parse the label: format is "{moves}_{order}"
  parts <- str_split(row$label, "_", n = 2)[[1]]
  participant_order <- str_split(parts[2], "-")[[1]]

  # Get stimulus names and extract morph levels
  stim_names <- c(row$stim1_name, row$stim2_name, row$stim3_name,
                  row$stim4_name, row$stim5_name, row$stim6_name)

  morph_levels <- sapply(stim_names, function(name) {
    as.integer(str_extract(name, "\\d+(?=\\.)"))
  })

  # Correct order: smallest to largest morph
  correct_order <- stim_names[order(morph_levels)]

  # Calculate sum of absolute position errors
  error <- 0
  for (i in seq_along(participant_order)) {
    correct_pos <- which(correct_order == participant_order[i])
    error <- error + abs(i - correct_pos)
  }

  return(error)
}

# Calculate scores for each trial
df <- df %>%
  rowwise() %>%
  mutate(error_score = calculate_error(cur_data())) %>%
  ungroup()

# Summary statistics
results <- df %>%
  summarise(
    total_error = sum(error_score),
    mean_error = mean(error_score),
    sd_error = sd(error_score)
  )

print(results)

# Analyze upright vs inverted
df <- df %>%
  mutate(is_inverted = str_detect(stim1_name, "inv_"))

df %>%
  group_by(is_inverted) %>%
  summarise(mean_error = mean(error_score))
Interpreting Scores
Typical performance on the CFPT:
| Performance Level | Total Error Score | Description |
|---|---|---|
| Normal | < 200 | Typical face perception ability |
| Borderline | 200-300 | Mild difficulties with face perception |
| Impaired | > 300 | Significant face perception deficits |
Individual Differences
The CFPT includes both upright and inverted face trials. Comparing performance between these conditions can reveal the "inversion effect" - typically, inverted faces are harder to discriminate than upright faces, reflecting specialized face processing mechanisms.
References
-
Duchaine, B., Germine, L., & Nakayama, K. (2007). Family resemblance: Ten family members with prosopagnosia and within-class object agnosia. Cognitive Neuropsychology, 24(4), 419–430. doi:10.1080/02643290701380491 ↩
-
Bowles, D. C., McKone, E., Dawel, A., Duchaine, B., Palermo, R., Schmalzl, L., Rivolta, D., Wilson, C. E., & Yovel, G. (2009). Diagnosing prosopagnosia: Effects of ageing, sex, and participant-stimulus ethnic match on the Cambridge Face Memory Test and Cambridge Face Perception Test. Cognitive Neuropsychology, 26(5), 423–455. doi:10.1080/02643290903343149 ↩