Label Task
The Label task presents stimuli one at a time and asks participants to provide a text description or label for each. This is useful for collecting free-form textual responses such as stimulus names, descriptions, associations, or any other text-based annotation.
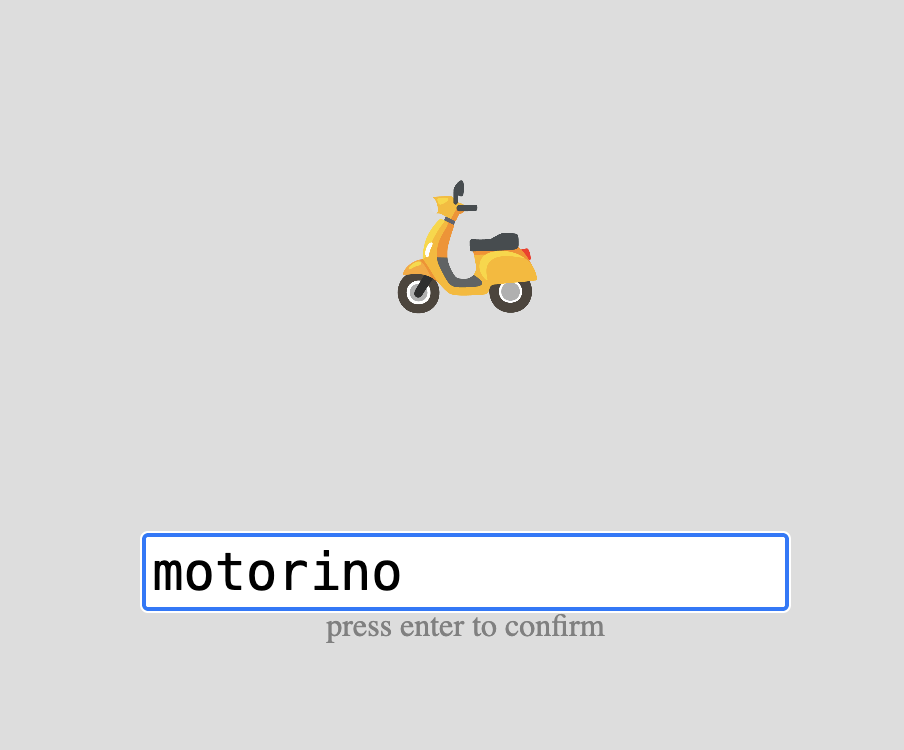
Example Label task showing a stimulus with a text input field below.
Below you'll find information specific to the Label task. This assumes you're familiar with how to setup an experiment and how to select stimuli for a given task.
Tip
The labels collected in this task can be used as text stimuli in a subsequent task. See Stimuli Selection and Configuration for details on how to select "labels" from a preceding task as your stimulus source.
Parameters
Customize the task by changing these on the Parameters tab of the task.
General Interface settings
Customize the instruction at the top of the page, as well as toolbar buttons. These apply to most task types on Meadows.
Instruction hint-
Text that you can display during the task at the top of the page.
Extended instruction-
A longer instruction that only appears if the participant hovers their mouse cursor over the hint.
Tip
Make clear to participants what type of label or description you're looking for. For example: "Enter a one-word name for this image" or "Describe this sound in a few words."
Hint size-
Whether to display the instruction, or hide it, and what font size to use.
Fullscreen button-
Whether to display a button in the bottom toolbar that participants can use to switch fullscreen mode on and off.
Text input settings
Control the constraints on participant text input.
Maximum Number Of Characters-
Maximum number of characters allowed per label. Default: 50. Must be between 1 and 200.
Minimum Number Of Characters-
Minimum number of characters required per label. Participants cannot submit until they've entered at least this many characters. Default: 1. Must be between 0 and 100.
Example
To collect single-word labels, you might set the minimum to 2 and maximum to 20. For longer descriptions, set the maximum to 100 or more.
Spatial configuration
Options for customizing the stimulus display.
Item Size-
Height of the stimuli. Default: 8.0. Must be between 0.2 and 40.0. The width is adapted according to the original aspect ratio of the stimulus.
Item Unit-
The unit to use for the size of the stimuli. Options:
- Percentage of the available width (default)
- Centimeters - requires participant calibration
- Visual angle in Degrees - requires participant calibration and distance measurement
See the documentation page "Dimensions, Units & Calibration" for more details.
Data
For general information about the various structures and file formats that you can download for your data see Downloads.
Stimulus-wise "annotations" (table rows). Each row represents one labeled stimulus. Columns:
taskName of the taskparticipationName of the experiment/participationtrialNumerical index of the trial (starting from 0)time_trial_startTimestamp when the stimulus was displayed (seconds since 1/1/1970)time_trial_responseTimestamp when the participant submitted their labelstim1_idMeadows internal ID of the stimulusstim1_nameFilename of the stimulus as uploadedlabelThe text label entered by the participant
In the Tree structure, under the task object:
annotationsAn array with a key/value map for each trial:trialNumerical index of the trialstartTimestamp (epoch time) of the start of the trial, in seconds since 1/1/1970respTimestamp (epoch time) of the response, in seconds since 1/1/1970idsArray containing the stimulus ID presented in this triallabelThe text label entered by the participant
stimuliArray of stimulus objects withidandnamefields
Analysis and Visualization
The Label task produces text data that can be analyzed for content, frequency, or used as input for further processing.
import pandas as pd
from collections import Counter

# Load annotations data
df = pd.read_csv('Meadows_myExperiment_v1_annotations.csv')

# View labels for each stimulus
labels_by_stimulus = df.groupby('stim1_name')['label'].apply(list)
print(labels_by_stimulus)

# Count label frequency across all stimuli
all_labels = df['label'].str.lower().tolist()
label_counts = Counter(all_labels)
print("Most common labels:", label_counts.most_common(10))

# Calculate response time
df['rt_seconds'] = df['time_trial_response'] - df['time_trial_start']
print(f"Mean response time: {df['rt_seconds'].mean():.2f} seconds")
library(dplyr)
library(ggplot2)

# Load data
df <- read.csv('Meadows_myExperiment_v1_annotations.csv')

# Calculate response time
df$rt_seconds <- df$time_trial_response - df$time_trial_start

# Summary by stimulus
df %>%
  group_by(stim1_name) %>%
  summarise(
    n_labels = n(),
    mean_rt = mean(rt_seconds),
    labels = paste(label, collapse = ", ")
  )

# Plot response time distribution
ggplot(df, aes(x = rt_seconds)) +
  geom_histogram(bins = 20, fill = "steelblue", color = "black") +
  labs(x = "Response Time (seconds)",
       y = "Count",
       title = "Label Response Time Distribution") +
  theme_minimal()