Gallery Select Task
The Gallery Select task displays multiple stimuli simultaneously and asks participants to select one. This task is ideal for preference studies, forced-choice experiments, or any paradigm where participants must choose between several visual alternatives. It is also well-suited for eyewitness lineup identification studies1.
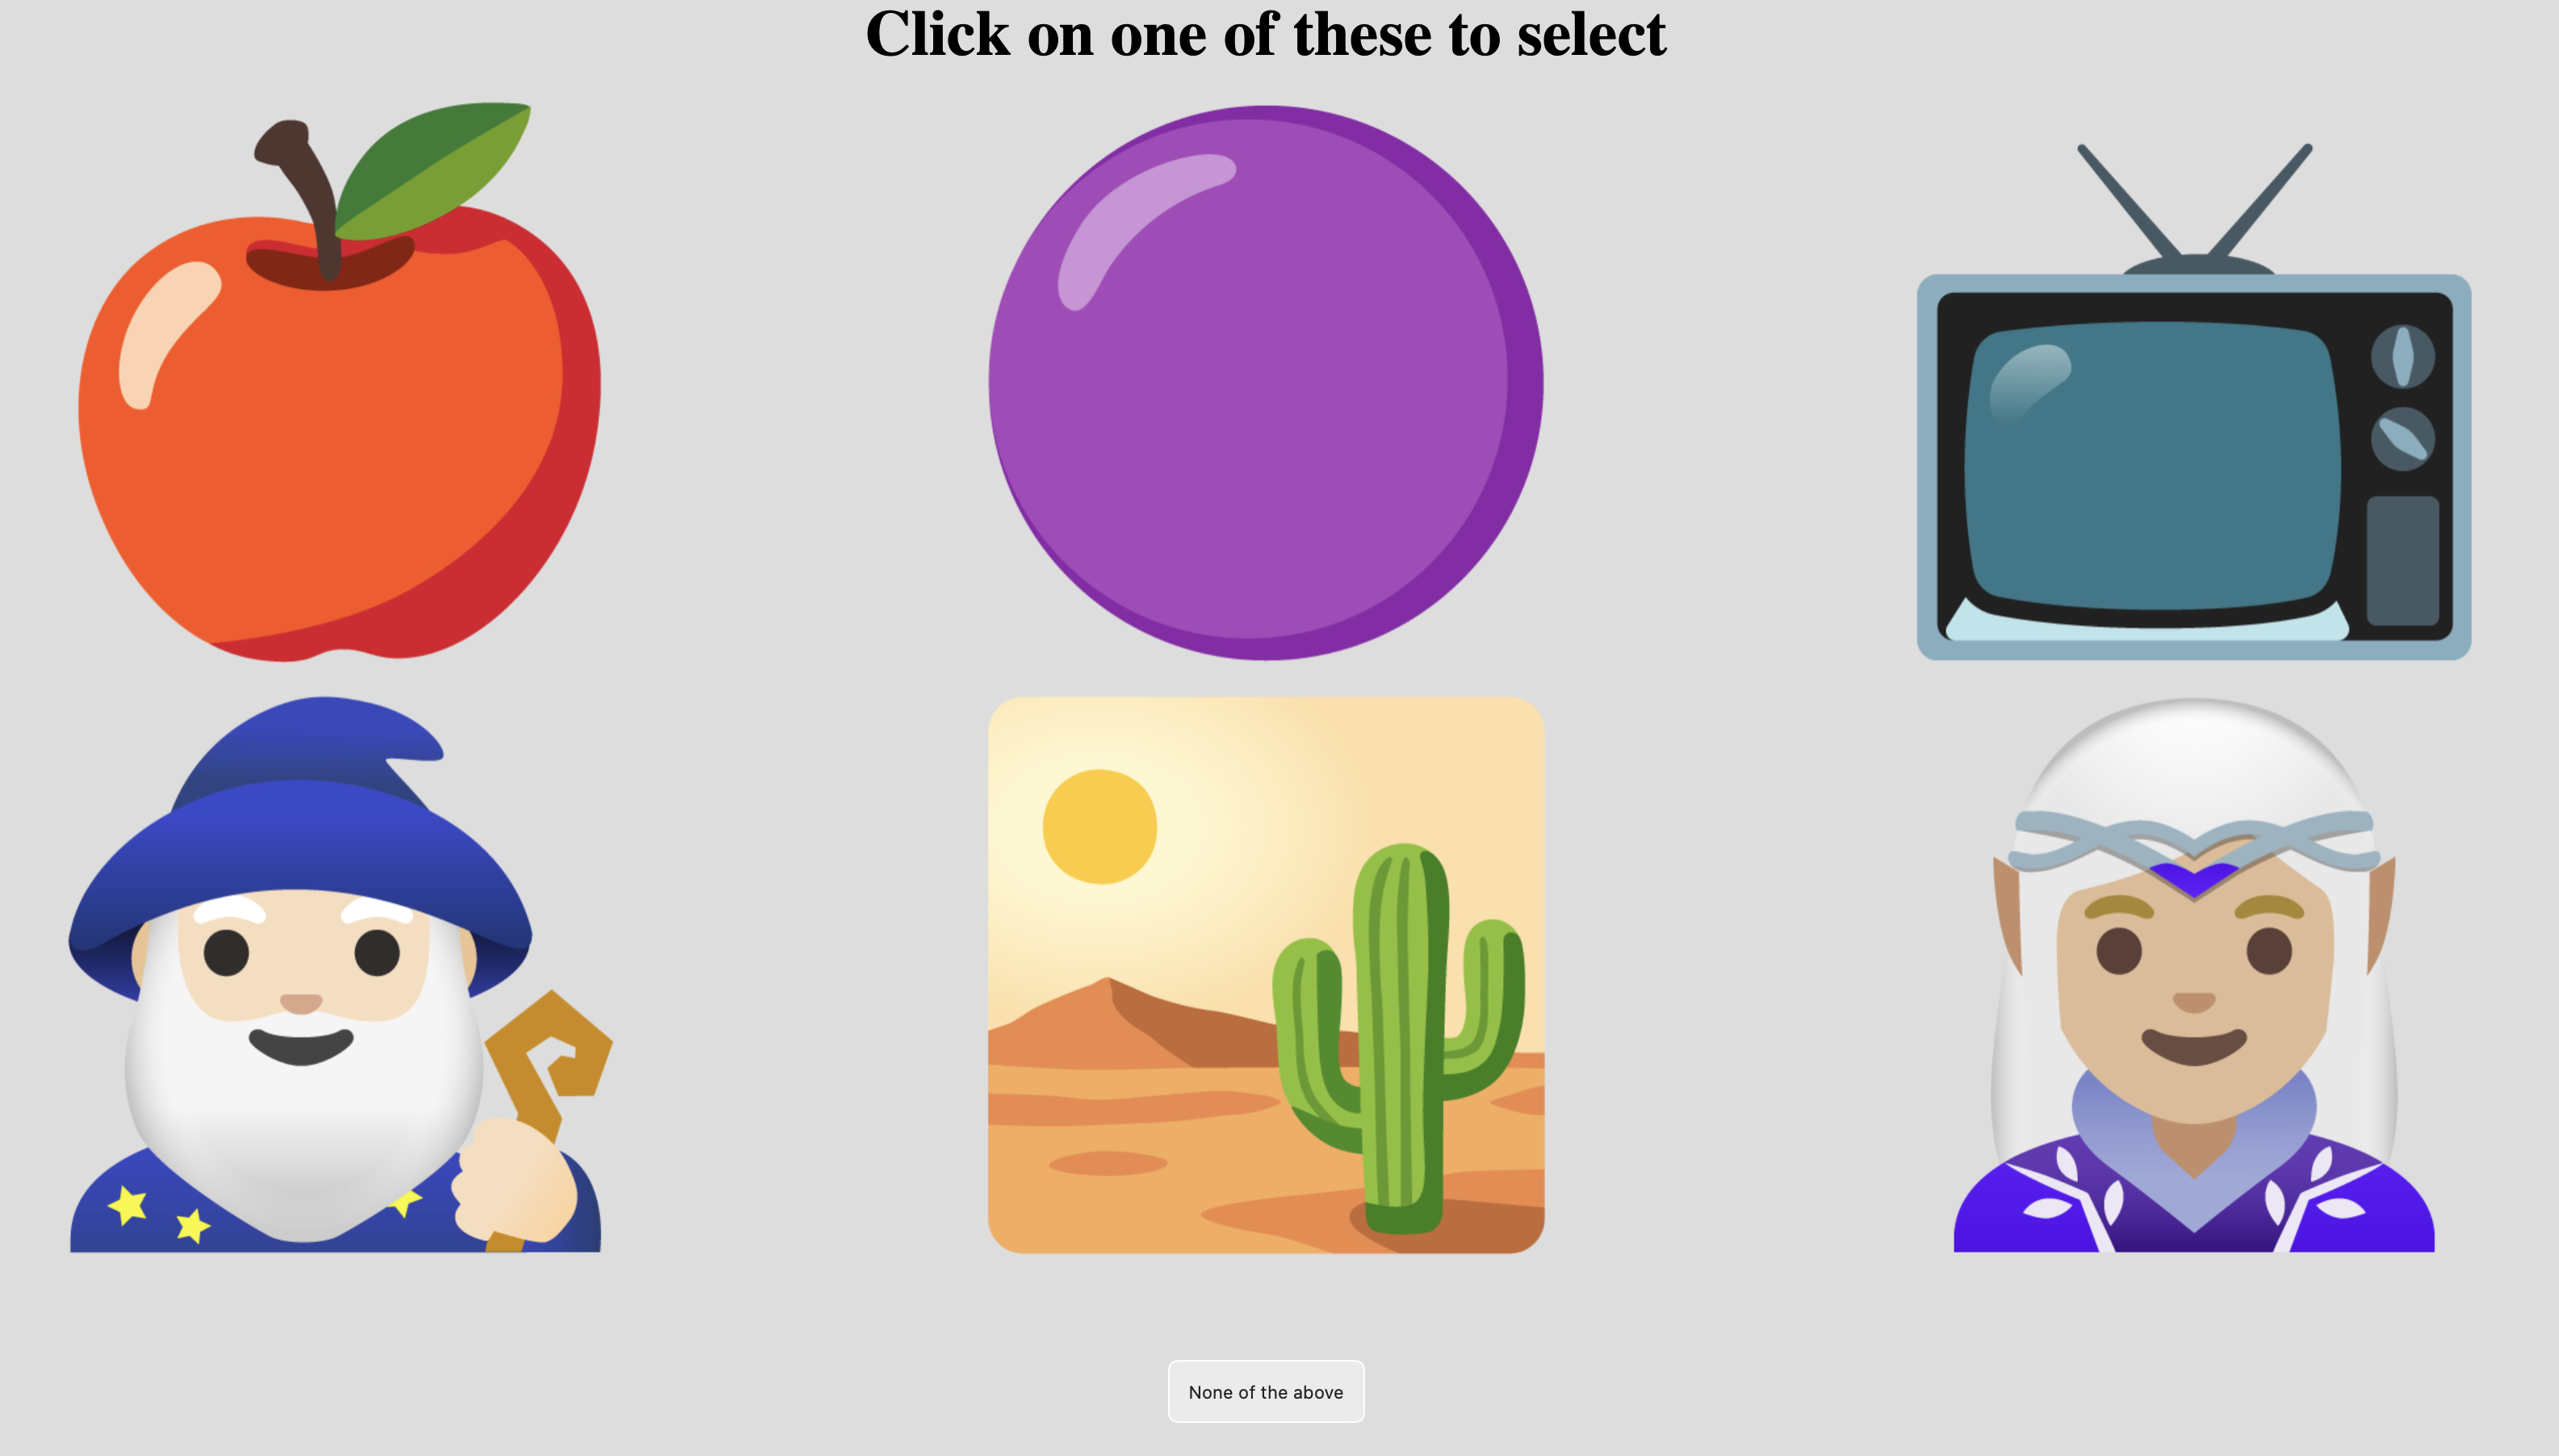
Example Gallery Select task showing six cartoon images for the participant to choose from, as well as a "None of the above" button.
Stimuli can be arranged in rows and columns, and you can optionally ask for confidence ratings after each selection. A "reject" option allows participants to indicate that none of the displayed stimuli match their choice.
Alternative Tasks
- Use Timed Key Response if you need reaction times with keyboard responses.
- Use Triplet Choice for odd-one-out similarity judgments with exactly three stimuli.
- Use Drag Rate for continuous ratings on a 2D canvas.
Parameters
Customize the task by changing these on the Parameters tab of the task.
General Interface Settings
Customize the instruction at the top of the page, as well as toolbar buttons. These apply to most task types on Meadows.
Instruction hint-
Text that you can display during the task at the top of the page.
Extended instruction-
A longer instruction that only appears if the participant hovers their mouse cursor over the hint.
Hint size-
Whether to display the instruction, or hide it, and what font size to use.
Fullscreen button-
Whether to display a button in the bottom toolbar that participants can use to switch fullscreen mode on and off.
Display Configuration
Control how stimuli are presented on screen.
Item height-
Height of the stimuli as a percentage of the available height. Default: 95%. Valid range: 1% to 100%.
Number of items-
Maximum number of stimuli displayed simultaneously in one trial. Default: 1. Valid range: 1 to 50.
Number of rows-
Number of rows on which to arrange the stimuli. Stimuli are distributed evenly across rows. Default: 1. Valid range: 1 to 10.
Layout Examples
- 4 items in 1 row: horizontal strip
- 4 items in 2 rows: 2×2 grid
- 6 items in 2 rows: 3×2 grid
- 9 items in 3 rows: 3×3 grid
Trial Generation
Maximum number of trials-
Maximum number of trials generated. This is ignored if you're using trial files. Default: 10. Valid range: 1 to 2000.
Confidence Rating
Optionally collect confidence judgments after each selection.
Ask for confidence-
When enabled, participants rate their confidence on a slider after each selection. Default: disabled.
Confirm button label-
The label on the button to confirm the confidence rating. Default: "Confirm". Max 20 characters.
Rating min label-
Label for the lowest value on the confidence slider. Default: "Guessing". Max 40 characters.
Rating max label-
Label for the highest value on the confidence slider. Default: "Certain". Max 40 characters.
Reject Option
Allow participants to indicate that none of the displayed stimuli are suitable.
Show reject button-
When enabled, displays a button that allows participants to continue without selecting any stimulus. Default: disabled.
Reject button label-
The text displayed on the reject button. Default: "None of the above". Max 50 characters.
Data
For general information about the various structures and file formats that you can download for your data see Downloads.
Stimulus-wise "annotations" (table rows). Each row represents one trial. Columns:
task- Name of the taskparticipation- Name of the experiment/participationtrial- Numerical index of the trial (starting from 0)time_trial_start- Timestamp when stimuli were displayed (seconds since 1/1/1970)time_trial_response- Timestamp when the participant made their selectionstim1_id,stim2_id, ... - Meadows internal IDs of the displayed stimulistim1_name,stim2_name, ... - Filenames of the displayed stimuli as uploadedlabel- The selection result (see below)
Label format:
The label column contains the participant's selection:
- Without confidence: the ID of the chosen stimulus, or
REJECTEDif the reject button was used - With confidence:
{chosen_id}_{confidence}where confidence is 0-10, e.g.,abc123_7orREJECTED_5
In the Tree structure, under the task object:
annotations- Array with one entry per trial:trial- Numerical index of the trialstart- Timestamp (epoch time) when stimuli appearedresp- Timestamp (epoch time) of the responseids- Array of stimulus IDs that were displayedlabel- The selection result (same format as annotations)
stimuli- Array of stimulus objects withidandnamefields
Analysis and Visualization
Selection Frequency
Analyze which stimuli were selected most frequently:
- Load Data: Import your
Meadows_myExperiment_v1_annotations.csvfile. - Parse the Label: If confidence was collected, split the
labelcolumn. In a new column, use: - Count Selections: Create a pivot table with stimulus names as rows and count of selections as values.
- Visualize: Create a bar chart from the pivot table to see selection frequencies.
import pandas as pd
import matplotlib.pyplot as plt

# Load annotations data
df = pd.read_csv('Meadows_myExperiment_v1_annotations.csv')

# Parse label to extract choice (handles confidence if present)
df['choice'] = df['label'].apply(lambda x: x.split('_')[0] if '_' in str(x) else x)
df['confidence'] = df['label'].apply(
    lambda x: int(x.split('_')[1]) if '_' in str(x) else None
)

# Count selections (excluding rejections)
selections = df[df['choice'] != 'REJECTED']['choice'].value_counts()
print("Selection counts:\n", selections)

# Plot selection frequency
plt.figure(figsize=(10, 6))
selections.plot(kind='bar')
plt.xlabel('Stimulus')
plt.ylabel('Times Selected')
plt.title('Selection Frequency')
plt.tight_layout()
plt.show()
library(tidyverse)

# Load data
df <- read_csv('Meadows_myExperiment_v1_annotations.csv')

# Parse label to extract choice and confidence
df <- df %>%
  mutate(
    choice = sapply(strsplit(label, "_"), `[`, 1),
    confidence = sapply(strsplit(label, "_"), function(x) {
      if(length(x) > 1) as.numeric(x[2]) else NA
    })
  )

# Count selections
selection_counts <- df %>%
  filter(choice != "REJECTED") %>%
  count(choice, sort = TRUE)

# Plot
ggplot(selection_counts, aes(x = reorder(choice, -n), y = n)) +
  geom_col(fill = "steelblue") +
  labs(x = "Stimulus", y = "Times Selected",
       title = "Selection Frequency") +
  theme_minimal() +
  theme(axis.text.x = element_text(angle = 45, hjust = 1))
References
-
Colloff, M. F., Wade, K. A., & Strange, D. (2016). Unfair lineups make witnesses more likely to confuse innocent and guilty suspects. Psychological Science, 27(9), 1227-1239. doi:10.1037/xap0000084 ↩