Drag & Rate Task
The Drag & Rate task allows participants to provide continuous ratings of stimuli on a single property while also indicating their confidence in that rating. Alternatively, the two-dimensional variant enables participants to continuously rate two different properties of the stimuli simultaneously.
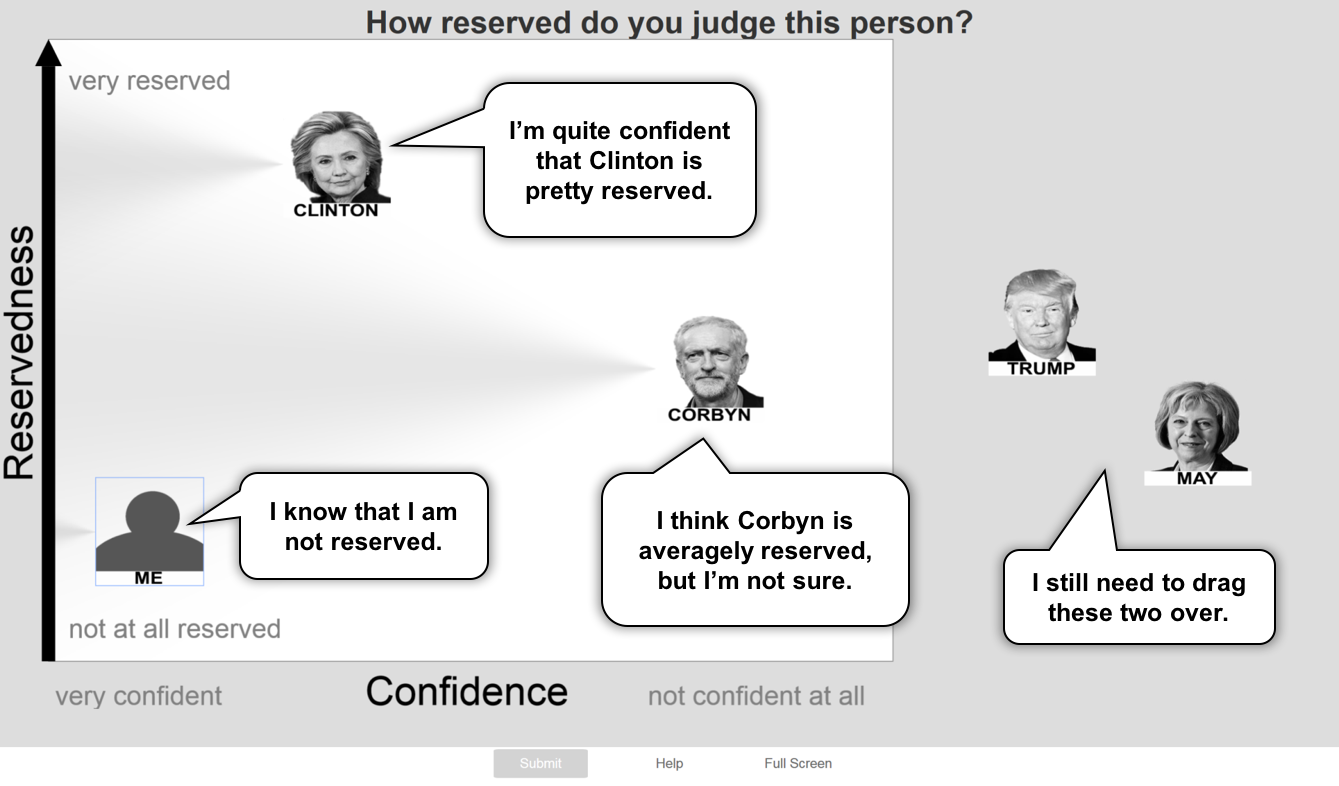
An example of the Drag & Rate task. Someone has rated several items, in this case politicians, on a scale ("Reservedness"). The item's vertical position (from botton to top) tells us how "reserved" you think this person is. The item's horizontal position (left to right) tells us how certain you are of your answer.
Below you'll find information specific to the Drag & Rate task. This assumes you're familiar with how to setup an experiment and how to select stimuli for a given task.
Parameters
Customize the task by changing these on the Parameters tab of the task.
General Interface settings
The layout and labels of the task
Instruction hint-
This will be displayed on the screen during the task. Max 80 characters.
Extended instruction-
Shown when the user hovers over the hint. Max 500 characters.
Show shadows-
Select to show a "shadow" originating from each stimulus, visualizing the participant's confidence spread. Default: True.
Info
Also called "Gaussian Fan", this feature makes sense only when you choose to use the horizontal axis to measure confidence.
Group selection enabled-
The participant will be able to drag-select a box around a number of stimuli and move them together as a group. Default: False.
Item Size-
Height of the stimuli in % of the width of the field. Default 8%. Must be between 2% and 20%. The width is adapted according to the original aspect ratio of the image.
Confidence scale label-
Default: "Confidence". Max 50 characters.
Confidence scale mininum value label-
Max 70 characters.
Confidence scale maximum value label-
Max 70 characters.
X-axis bar-
Show a bar for the x-axis. Deselected by default.
Property scale label-
E.g. "Pleasantness". Max 50 characters.
Property scale minimum value label-
E.g. "Not pleasant at all". Max 70 characters.
Property scale maximum value label-
E.g. "Very pleasant". Max 70 characters.
Grid columns-
Display edges between this many columns in the rated space. Default: 1. Must be between 1 and 20.
Grid rows-
Display edges between this many rows in the rated space. Default: 1. Must be between 1 and 20.
Trials
Max stimuli per trial-
If the number of stimuli chosen for this task is larger than this number, the task will be split into trials with this amount of stimuli per trial. Default: 100. Must be between 1 and 300.
Reference Stimuli
You can place reference stimuli at fixed locations in the rating space to serve as anchor points for participants.
Stimulus name pattern-
The name or part of the name of the stimulus to use as a reference. Max 50 characters.
Reference location-
Where to display reference stimulus. Options:
- In-axis (choose coordinates below)
- Near the top of the staging area
Reference size-
Height of the reference stimulus (same unit as regular stimuli). Default: 8.0. Must be between 0.2 and 20.0.
Reference outline thickness-
Width of the border around the reference stimulus. Set to 0 for no outline. Default: 0. Must be between 0 and 50.
Reference outline color-
Color of the border around the reference stimulus. Options: Red, Green, Blue, Black, White.
Reference X coordinate-
The horizontal location in the axis, between 0 and 1. Default: 0.5.
Reference Y coordinate-
The vertical location in the axis, between 0 and 1. Default: 0.5.
Data
For general information about the various structures and file formats that you can download for your data see Downloads.
As stimulus-wise "annotations" (table rows), with columns:
trialnumerical index of the trialstim_idmeadows internal id of the stimulusstim_namefilename of the stimulus as uploadedxrelative horizontal coordinate (confidence axis)yrelative vertical coordinate (property axis)
In the Tree structure:
trialsAn array with a key/value map for each of the trials that the participant finished:startTimestamp or epoch time of the start of the trial, in seconds since 1/1/1970.endTimestamp epoch time of the end of the trial, in seconds since 1/1/1970.positionsAn array with a key/value map for each of the stimuli:xrelative horizontal coordinate of the stimulus (confidence).yrelative vertical coordinate of the stimulus (property rating).idThe ID of the stimulus, corresponding to the ID field in the stimulus list.
Analysis and Visualization
Plot ratings
Plot a combined histogram and scatterplot for both dimensions
library(ggplot2)

# Load annotations data
df <- read.csv('Meadows_myExperiment_v_1_white-rabbit_1_annotations.csv')

# Scatterplot of x (confidence) vs y (property rating)
ggplot(df, aes(x = x, y = y)) +
  geom_point(alpha = 0.6) +
  labs(x = 'Confidence', y = 'Property Rating',
       title = 'Stimulus Ratings') +
  theme_minimal()

# Summary statistics
cat(sprintf("Mean confidence (x): %.3f\n", mean(df$x)))
cat(sprintf("Mean property rating (y): %.3f\n", mean(df$y)))
In Google Sheets or Microsoft Excel, you can analyze ratings from your downloaded annotations data.
- Load Data: Import the
Meadows_myExperiment_v1_annotations.csvfile into your spreadsheet. - Calculate Summary Statistics: Use built-in functions to summarize ratings:
- Mean confidence (x):
=AVERAGE(x_column) - Mean property rating (y):
=AVERAGE(y_column) - Standard deviation:
=STDEV.S(x_column)and=STDEV.S(y_column) - Correlation: Calculate the correlation between confidence and property rating:
- Visualize: Create a scatter chart by selecting both the
xandycolumns to display the relationship between confidence and property ratings. - Per-Stimulus Analysis: To see the average rating for each stimulus, use a Pivot Table with
stim_nameas the Row field and average ofyas the Value field.