Card Sorting Task
The Card Sorting task enables participants to categorize stimuli by dragging them into labeled groups called "piles." This implementation allows flexible categorization of stimuli, conceptually related to classic card sorting paradigms in psychology1, adapted here for perceptual and cognitive research. The task can also be used for information architecture and user experience research2. This task is useful for studying categorical perception, semantic grouping, and similarity judgments in a naturalistic way.
Stimuli are represented as draggable cards that can be placed into rectangular piles displayed on screen. Each pile shows a preview of recently added cards, and participants can create, rename, or remove piles as they organize the stimuli. The task supports both closed card sorting (where you provide predefined categories) and open card sorting (where participants create their own categories).
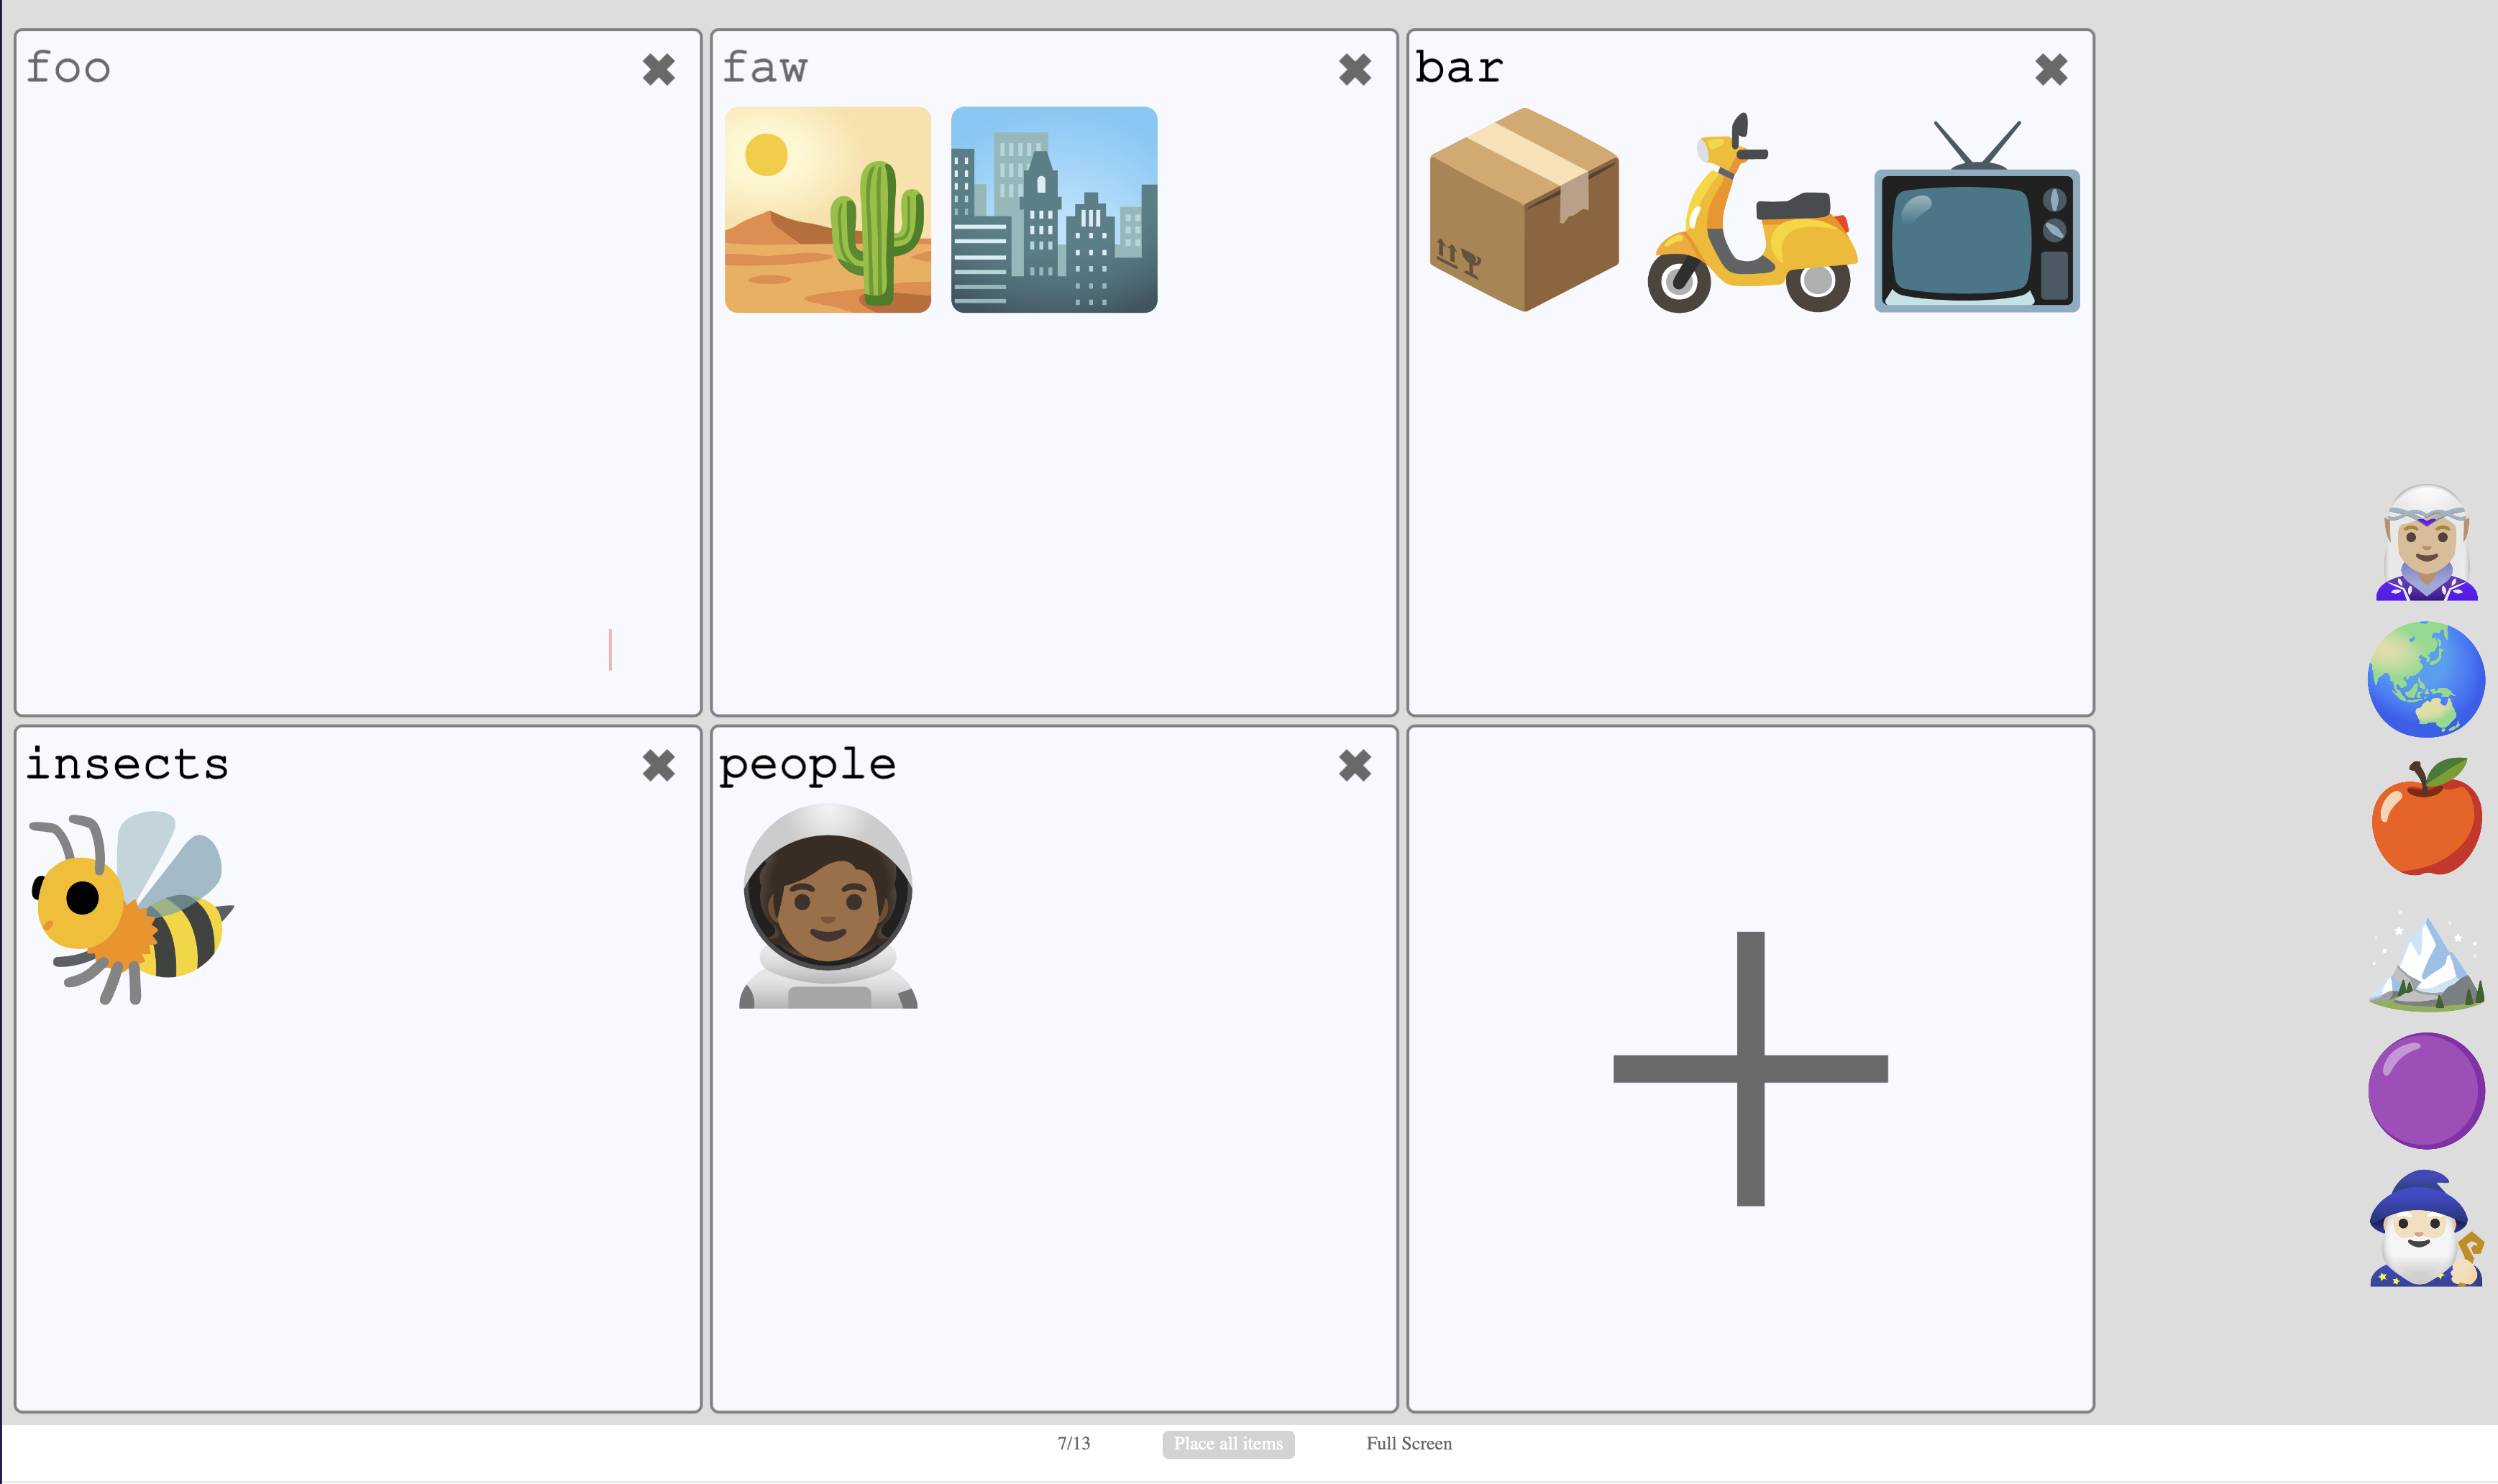
Example Card Sorting task showing stimuli being organized into categories
Below you'll find information specific to the Card Sorting task. This assumes you're familiar with how to setup an experiment and how to select stimuli for a given task.
Parameters
Customize the task by changing these on the Parameters tab of the task.
General Interface settings
Customize the instruction at the top of the page, as well as toolbar buttons. These apply to most task types on Meadows.
Instruction hint-
Text that you can display during the task at the top of the page.
Extended instruction-
A longer instruction that only appears if the participant hovers their mouse cursor over the hint.
Hint size-
Whether to display the instruction, or hide it, and what font size to use.
Fullscreen button-
Whether to display a button in the bottom toolbar that participants can use to switch fullscreen mode on and off.
Stimuli Display
Control the appearance and organization of the stimulus cards.
Item Size-
Height of the stimuli in % of the width of the field. Default 8%. Must be between 0.2% and 20%. The width is adapted according to the original aspect ratio of the stimulus.
Randomize Order-
Whether to display stimuli in a randomized order. When unchecked, stimuli appear in the order they were uploaded or specified. Default: unchecked.
Pile Configuration
Control the appearance and behavior of the category piles.
Piles-
Pre-defined category names (comma-separated). Leave empty to have participants create all categories themselves (open card sorting). Providing categories implements closed card sorting. Example: "Animals, Plants, Objects"
Allow Changing Piles-
Whether to allow participants to create, rename, and remove piles. Default: checked. When unchecked (and piles are predefined), this creates a fully closed card sorting task.
Max Number of Piles-
Maximum number of piles that may be created. Default: 6. Must be between 0 and 50.
Scale Piles-
If turned on, piles will resize to use available space. If turned off, their size remains constant based on the maximum number of piles allowed. Default: checked.
Max Examples-
How many recently-added stimuli to display as examples within each pile. Default: 5. Must be between 0 and 50.
Pile Aspect Ratio-
The width:height ratio of the piles. Options: 1:2, 1:1 (default), or 2:1.
Pile Labels
Control the naming and display of category labels.
Hide Labels-
Hide pile labels from view. When enabled, auto-generation of labels is turned on automatically. Default: unchecked.
Auto Generate Labels-
New piles will automatically receive labels (a, b, c, etc.) rather than requiring participants to name them. Always on if labels are hidden. Default: unchecked.
Pile Label Minimum Length-
Minimum number of characters required for pile labels. Default: 1. Must be between 0 and 50.
Pile Label Maximum Length-
Maximum number of characters allowed for pile labels. Default: 10. Must be between 0 and 50.
Interaction Settings
Fine-tune the user interaction behavior.
Mouse Cursor Targeting-
Determines whether a stimulus is over a pile using the mouse cursor position instead of the card center. This can provide more intuitive drag-and-drop behavior. Default: checked.
Threshold Confirm Removal-
When removing a pile, the participant will be prompted to confirm if the pile contains this many stimuli or more. Default: 5. Must be between 2 and 50.
Display Task Hints-
Display contextual help text that updates based on what the participant is doing (e.g., "drop the card here to add it to this pile"). Default: checked.
Data
For general information about the various structures and file formats that you can download for your data see Downloads.
As stimulus-wise "annotations" (table rows), with columns:
trialalways 0 for this task (trials are not meaningful since participants can undo annotations)time_trial_startWhen the stimulus was first picked uptime_trial_responseWhen the stimulus was placed in a pilestim1_idMeadows internal id of the stimulusstim1_nameFilename of the stimulus as uploadedlabelThe name of the pile/category the stimulus was assigned to
In the Tree structure:
annotationsAn array with a map for each stimulus categorization:idsArray containing the stimulus IDstartTimestamp of when the stimulus was picked up (epoch time in seconds)respTimestamp of when the stimulus was placed in a pile (epoch time in seconds)labelThe name of the category/pile assigned to this stimulustrialAlways 0 for this task
Analysis and Visualization
Analyze category assignments
import pandas as pd
import matplotlib.pyplot as plt
from collections import Counter

# Load annotations data
df = pd.read_csv('Meadows_myExperiment_v1_annotations.csv')

# Count how many stimuli were assigned to each category
category_counts = df['label'].value_counts()
print(category_counts)

# Plot distribution
category_counts.plot(kind='bar')
plt.xlabel('Category')
plt.ylabel('Number of Stimuli')
plt.title('Stimuli per Category')
plt.tight_layout()
plt.show()
For multiple participants, analyze inter-rater agreement:
import pandas as pd
import numpy as np
from sklearn.metrics import adjusted_rand_score

# Load data from multiple participants
df = pd.read_csv('Meadows_myExperiment_v1_annotations.csv')

# Create a pivot table: rows=stimuli, columns=participants, values=categories
pivot = df.pivot_table(
    index='stim1_name',
    columns='participation',
    values='label',
    aggfunc='first'
)

# Calculate pairwise agreement between participants
participants = pivot.columns
for i, p1 in enumerate(participants):
    for p2 in participants[i+1:]:
        # Remove any stimuli where either participant didn't categorize
        valid = pivot[[p1, p2]].dropna()
        score = adjusted_rand_score(valid[p1], valid[p2])
        print(f"Agreement between {p1} and {p2}: {score:.3f}")
library(ggplot2)

# Load annotations data
data <- read.csv('Meadows_myExperiment_v1_annotations.csv')

# Count stimuli per category
category_counts <- table(data$label)

# Plot distribution
barplot(category_counts,
        xlab='Category',
        ylab='Number of Stimuli',
        main='Stimuli per Category',
        las=2)  # Rotate labels
In Google Sheets or Microsoft Excel, you can analyze category assignments from your downloaded annotations data.
- Load Data: Import the
Meadows_myExperiment_v1_annotations.csvfile into your spreadsheet. - Count Stimuli per Category: Use
COUNTIFto count how many stimuli are in each category: - Create a Summary Table: In a new area, list each unique category name and use the formula above to count stimuli per category.
- Alternative - Pivot Table: Select your data range and insert a Pivot Table. Set
labelas the Row field and count ofstim1_nameas the Value field to automatically summarize counts per category. - Visualize: Create a bar chart from your summary table or pivot table to display the distribution of stimuli across categories.
References
-
Berg, E. A. (1948). A simple objective technique for measuring flexibility in thinking. The Journal of General Psychology, 39(1), 15-22. doi: 10.1080/00221309.1948.9918159 ↩
-
Spencer, D. (2009). Card Sorting: Designing Usable Categories. Brooklyn, NY: Rosenfeld Media. Online guide ↩