Attentional Blink
The Attentional Blink task is an implementation of the classic attentional blink paradigm1, a well-established method for investigating temporal attention. In this paradigm, participants view a rapid serial visual presentation (RSVP) stream of items and are asked to identify two targets embedded among distractors. The attentional blink refers to the phenomenon where people often fail to detect the second target (T2) if it appears 200-500 milliseconds after the first target (T1).
This task is particularly useful for studying temporal limitations of attention, the capacity for processing multiple targets in quick succession, and how emotional or salient stimuli can modulate attention.
It's also been shown2 that the similarity between two stimuli affects the magnitude of the blink.
Below you'll find information specific to the Attentional Blink task. This assumes you're familiar with how to setup an experiment and how to select stimuli for a given task.
Parameters
Customize the task by changing these on the Parameters tab of the task.
General Interface settings
Customize the instruction at the top of the page, as well as toolbar buttons. These apply to most task types on Meadows.
Instruction hint-
Text that you can display during the task at the top of the page.
Extended instruction-
A longer instruction that only appears if the participant hovers their mouse cursor over the hint.
Hint size-
Whether to display the instruction, or hide it, and what font size to use.
Fullscreen button-
Whether to display a button in the bottom toolbar that participants can use to switch fullscreen mode on and off.
Trial Configuration
Control the number and structure of trials.
Maximum Number Of Trials-
The number of trials will equal the total number of unique combinations of stimuli, or this parameter, whichever is smaller. Default: 50. Range: 1-10,000.
Proportion Of Identical Pairs-
How many of the total number of trials should be "catch trials", with the same stimulus shown twice. This allows you to assess whether participants can detect repeated items. Default: 0.3 (30%). Range: 0.0-0.9.
Timing Parameters
Control the temporal dynamics of the RSVP stream.
Item Duration-
How long each stimulus and mask is shown, in milliseconds. This determines the presentation rate of items in the stream. Default: 500 ms. Range: 1-5,000 ms.
Info
A shorter item duration increases the difficulty of target detection and may strengthen the attentional blink effect. Common values range from 80-120 ms for challenging tasks.
Blank Duration-
How long to show a blank screen after each stimulus and mask, in milliseconds. This creates a brief gap between consecutive items. Default: 30 ms. Range: 1-5,000 ms.
Pause Duration-
How long to display a fixation cross before and after the stream, in milliseconds. This gives participants time to prepare and ensures they're fixating at the center. Default: 2,000 ms. Range: 1-9,000 ms.
Stream Structure
Define the composition and timing of the RSVP stream.
Stream Length-
How many items to present in one trial. This includes both targets and distractors. Default: 19. Range: 1-50.
T1 Position-
Where in the stream the first target is presented (item number). Default: 5. Range: 1-50.
Note
The T1 position should be early enough to allow space for T2 to appear later, but late enough to establish the rhythm of the stream.
T2 Position-
Where in the stream the second target is presented, with equal probability for each value specified. You can specify one or two positions. Default: [7, 13]. Range: 1-50.
Lag manipulation
By varying the T2 position relative to T1, you can manipulate the "lag" between targets. For example, if T1 is at position 5 and T2 is at position 7, this creates a lag-2 condition. The attentional blink is typically strongest at lags 2-4 (200-400 ms at typical presentation rates) and shows "lag-1 sparing" when targets appear consecutively.
Masking
Configure the visual masks or "distractors" that follow each stimulus.
Mask Spatial Frequency-
Number of rows and columns to use when generating the scrambled mask. The mask is created by dividing each stimulus into a grid and scrambling the pieces. Note that the resolution of the image must be a multiple of this number. Default: 8. Range: 2-200.

Checkerboard-scrambled mask generated by Meadows from stimuli selected for the task
Warning
Higher values create finer-grained scrambling but require higher resolution images. If your stimulus resolution is not divisible by this value, the task will not start.
Response Prompts
Customize how participants report their target detections.
T1 Prompt Type-
What kind of challenge to present with regard to the first target. Options:
- None: No prompt for T1
- Choice among three stimuli: Participant selects from three image options including the target
- Choice among three stimulus names: Participant selects from three text labels
- Any key response: Participant responds to a custom text prompt with any keypress
Default: Choice among three stimuli.
T1 Prompt Text-
The text shown in the challenge with regard to the first target. Default: "Which of these did you see first?"
T2 Prompt Type-
What kind of challenge to present with regard to the second target. Same options as T1. Default: Choice among three stimuli.
T2 Prompt Text-
The text shown in the challenge with regard to the second target. Default: "Which of these did you see second?"
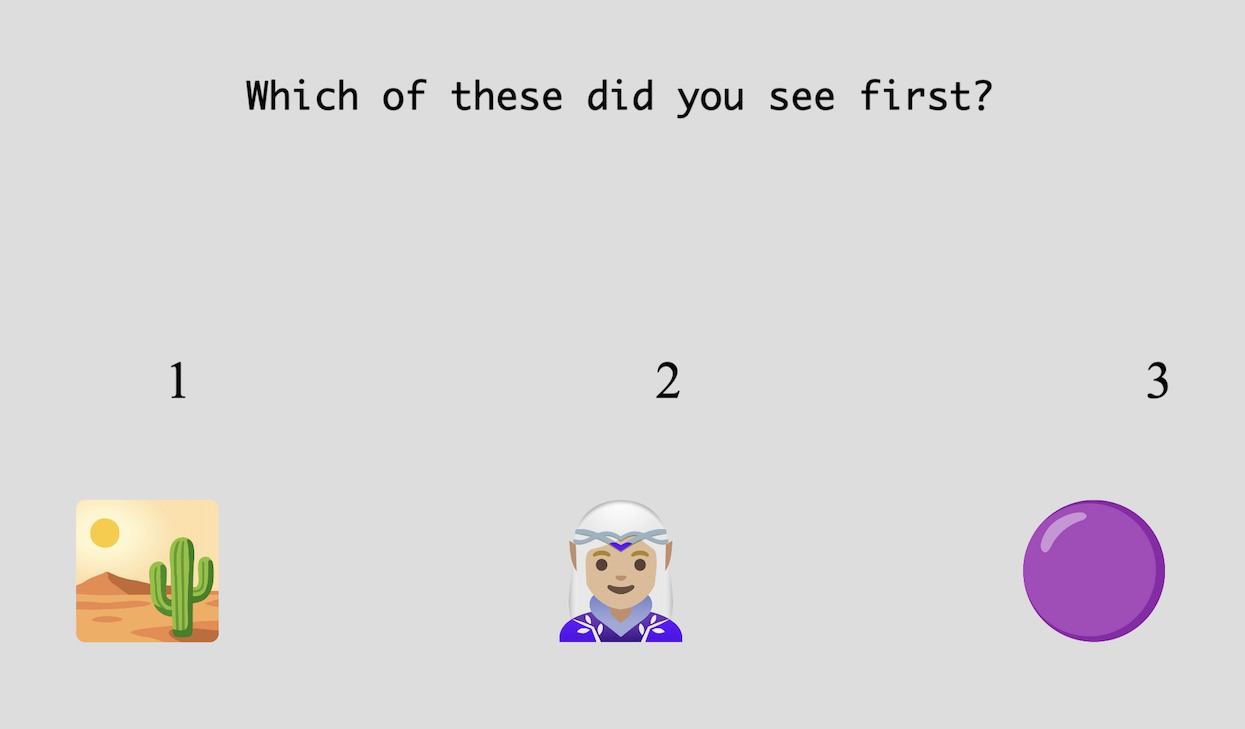
One option for how participants can respond to T1 in the Attentional Blink task
Data
For general information about the various structures and file formats that you can download for your data see Downloads.
As trial-wise "annotations", with columns:
trialnumerical index of the trialtaskname of the taskparticipationname of the participationlabelunderscore separated list with the following values:- T2 position
- ID of first choice
- ID of second choice
time_trial_starttimestamp when the trial startedtime_trial_endtimestamp when the trial endedstim1_idmeadows ID of the first stimulusstim1_namefilename of the first stimulusstim2_idmeadows ID of the second stimulusstim2_namefilename of the second stimulus
In the Tree structure, a variable annotations
with the following key/value pairs:
trialnumerical index of the trialidsthe meadows internal IDs of the stimuli in the trialstarttimestamp of the trial startresptimestamp of the trial endlabelunderscore separated list with the following values:- T2 position
- ID of first choice
- ID of second choice
Analysis and Visualization
The primary analysis for attentional blink data is to examine T2 accuracy conditional on T1 accuracy, plotted as a function of lag. This reveals the characteristic "U-shaped" curve showing the attentional blink effect.
Plot T2 accuracy by lag
import pandas as pd
import matplotlib.pyplot as plt

# Load annotations data
df = pd.read_csv('Meadows_myExperiment_v1_annotations.csv')

# Parse the label field to extract T2 position and response IDs
df[['t2_position', 't1_response', 't2_response']] = df['label'].str.split('_', expand=True)
df['t2_position'] = df['t2_position'].astype(int)

# Calculate correctness: compare response IDs with actual stimulus IDs
df['t1_correct'] = df['t1_response'] == df['stim1_id']
df['t2_correct'] = df['t2_response'] == df['stim2_id']

# Calculate lag (T2 position - T1 position)
# Note: T1 position is set in task parameters (e.g., 5)
t1_position = 5  # Update this to match your task settings
df['lag'] = df['t2_position'] - t1_position

# Filter for trials where T1 was correctly identified
df_t1_correct = df[df['t1_correct'] == True]

# Calculate T2 accuracy for each lag
accuracy_by_lag = df_t1_correct.groupby('lag')['t2_correct'].mean()

# Plot
plt.figure(figsize=(10, 6))
plt.plot(accuracy_by_lag.index, accuracy_by_lag.values, 'o-')
plt.xlabel('Lag (T2 position - T1 position)')
plt.ylabel('T2 Accuracy (given T1 correct)')
plt.title('Attentional Blink Effect')
plt.grid(True, alpha=0.3)
plt.ylim([0, 1])
plt.show()
library(tidyverse)

# Load annotations data
df <- read_csv('Meadows_myExperiment_v1_annotations.csv')

# Parse the label field to extract T2 position and response IDs
df <- df %>%
  separate(label, into = c('t2_position', 't1_response', 't2_response'), sep = '_') %>%
  mutate(t2_position = as.numeric(t2_position))

# Calculate correctness: compare response IDs with actual stimulus IDs
df <- df %>%
  mutate(
    t1_correct = t1_response == stim1_id,
    t2_correct = t2_response == stim2_id,
    # Calculate lag (T2 position - T1 position)
    # Note: T1 position is set in task parameters (e.g., 5)
    lag = t2_position - 5  # Update this to match your task settings
  )

# Filter for trials where T1 was correctly identified and calculate accuracy
accuracy_by_lag <- df %>%
  filter(t1_correct == TRUE) %>%
  group_by(lag) %>%
  summarise(t2_accuracy = mean(t2_correct))

# Plot
ggplot(accuracy_by_lag, aes(x = lag, y = t2_accuracy)) +
  geom_line() +
  geom_point(size = 3) +
  labs(
    x = 'Lag (T2 position - T1 position)',
    y = 'T2 Accuracy (given T1 correct)',
    title = 'Attentional Blink Effect'
  ) +
  ylim(0, 1) +
  theme_minimal()
Calculate attentional blink magnitude
The magnitude of the attentional blink can be quantified as the difference between baseline T2 accuracy (at long lags) and accuracy during the blink period (typically lags 2-4).
# Calculate blink magnitude (requires processing from previous example)
baseline_lags = df_t1_correct[df_t1_correct['lag'] >= 6]
blink_lags = df_t1_correct[df_t1_correct['lag'].between(2, 4)]

baseline_accuracy = baseline_lags['t2_correct'].mean()
blink_accuracy = blink_lags['t2_correct'].mean()
blink_magnitude = baseline_accuracy - blink_accuracy

print(f"Attentional Blink Magnitude: {blink_magnitude:.3f}")
# Calculate blink magnitude (requires processing from previous example)
baseline_lags <- df %>%
  filter(t1_correct == TRUE, lag >= 6)

blink_lags <- df %>%
  filter(t1_correct == TRUE, lag >= 2, lag <= 4)

baseline_accuracy <- mean(baseline_lags$t2_correct)
blink_accuracy <- mean(blink_lags$t2_correct)
blink_magnitude <- baseline_accuracy - blink_accuracy

cat(sprintf("Attentional Blink Magnitude: %.3f\n", blink_magnitude))
References
-
Raymond, J. E., Shapiro, K. L., & Arnell, K. M. (1992). Temporary suppression of visual processing in an RSVP task: An attentional blink? Journal of Experimental Psychology: Human Perception and Performance, 18(3), 849–860. doi ↩
-
Lindh, D., Sligte, I.G., Assecondi, S. et al. Conscious perception of natural images is constrained by category-related visual features. Nat Commun 10, 4106 (2019). doi ↩